Senegalese vs Northern European Family Households with Children
COMPARE
Senegalese
Northern European
Family Households with Children
Family Households with Children Comparison
Senegalese
Northern Europeans
26.6%
FAMILY HOUSEHOLDS WITH CHILDREN
0.4/ 100
METRIC RATING
280th/ 347
METRIC RANK
27.2%
FAMILY HOUSEHOLDS WITH CHILDREN
12.8/ 100
METRIC RATING
215th/ 347
METRIC RANK
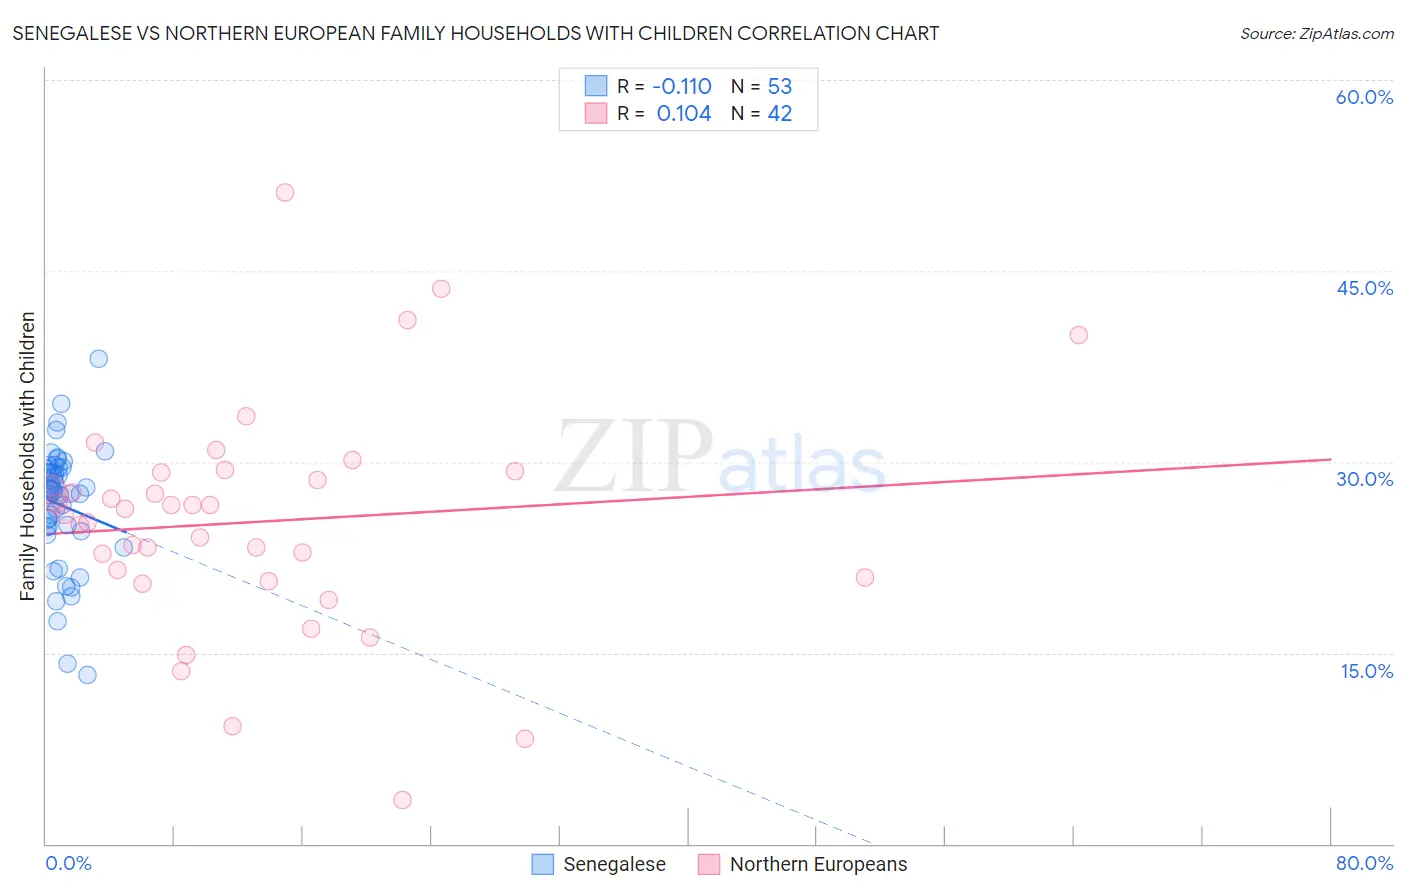
Senegalese vs Northern European Family Households with Children Correlation Chart
The statistical analysis conducted on geographies consisting of 78,103,218 people shows a poor negative correlation between the proportion of Senegalese and percentage of family households with children in the United States with a correlation coefficient (R) of -0.110 and weighted average of 26.6%. Similarly, the statistical analysis conducted on geographies consisting of 405,770,023 people shows a poor positive correlation between the proportion of Northern Europeans and percentage of family households with children in the United States with a correlation coefficient (R) of 0.104 and weighted average of 27.2%, a difference of 2.1%.
Family Households with Children Correlation Summary
| Measurement | Senegalese | Northern European |
| Minimum | 13.3% | 3.5% |
| Maximum | 38.1% | 51.2% |
| Range | 24.8% | 47.7% |
| Mean | 26.6% | 25.3% |
| Median | 27.7% | 26.1% |
| Interquartile 25% (IQ1) | 24.7% | 20.9% |
| Interquartile 75% (IQ3) | 29.4% | 29.2% |
| Interquartile Range (IQR) | 4.7% | 8.3% |
| Standard Deviation (Sample) | 4.7% | 9.0% |
| Standard Deviation (Population) | 4.7% | 8.8% |
Similar Demographics by Family Households with Children
Demographics Similar to Senegalese by Family Households with Children
In terms of family households with children, the demographic groups most similar to Senegalese are Finnish (26.6%, a difference of 0.020%), Immigrants from Europe (26.6%, a difference of 0.050%), Lithuanian (26.6%, a difference of 0.090%), Celtic (26.6%, a difference of 0.10%), and French American Indian (26.6%, a difference of 0.11%).
| Demographics | Rating | Rank | Family Households with Children |
| Immigrants | Hungary | 0.6 /100 | #273 | Tragic 26.7% |
| Eastern Europeans | 0.6 /100 | #274 | Tragic 26.7% |
| Immigrants | Northern Europe | 0.5 /100 | #275 | Tragic 26.7% |
| Immigrants | Spain | 0.5 /100 | #276 | Tragic 26.6% |
| Celtics | 0.4 /100 | #277 | Tragic 26.6% |
| Immigrants | Europe | 0.4 /100 | #278 | Tragic 26.6% |
| Finns | 0.4 /100 | #279 | Tragic 26.6% |
| Senegalese | 0.4 /100 | #280 | Tragic 26.6% |
| Lithuanians | 0.3 /100 | #281 | Tragic 26.6% |
| French American Indians | 0.3 /100 | #282 | Tragic 26.6% |
| Immigrants | North America | 0.3 /100 | #283 | Tragic 26.6% |
| Immigrants | Canada | 0.3 /100 | #284 | Tragic 26.5% |
| Cambodians | 0.2 /100 | #285 | Tragic 26.5% |
| Immigrants | Senegal | 0.2 /100 | #286 | Tragic 26.5% |
| Shoshone | 0.2 /100 | #287 | Tragic 26.5% |
Demographics Similar to Northern Europeans by Family Households with Children
In terms of family households with children, the demographic groups most similar to Northern Europeans are African (27.2%, a difference of 0.010%), Cuban (27.1%, a difference of 0.030%), U.S. Virgin Islander (27.1%, a difference of 0.030%), Okinawan (27.2%, a difference of 0.040%), and Immigrants from Dominica (27.2%, a difference of 0.050%).
| Demographics | Rating | Rank | Family Households with Children |
| Immigrants | Poland | 16.4 /100 | #208 | Poor 27.2% |
| Dutch West Indians | 15.8 /100 | #209 | Poor 27.2% |
| Immigrants | Ukraine | 14.4 /100 | #210 | Poor 27.2% |
| Welsh | 14.2 /100 | #211 | Poor 27.2% |
| Immigrants | Dominica | 13.9 /100 | #212 | Poor 27.2% |
| Okinawans | 13.7 /100 | #213 | Poor 27.2% |
| Africans | 13.0 /100 | #214 | Poor 27.2% |
| Northern Europeans | 12.8 /100 | #215 | Poor 27.2% |
| Cubans | 12.2 /100 | #216 | Poor 27.1% |
| U.S. Virgin Islanders | 12.1 /100 | #217 | Poor 27.1% |
| Greeks | 11.4 /100 | #218 | Poor 27.1% |
| Immigrants | Japan | 10.7 /100 | #219 | Poor 27.1% |
| Austrians | 9.9 /100 | #220 | Tragic 27.1% |
| New Zealanders | 9.6 /100 | #221 | Tragic 27.1% |
| Paraguayans | 9.4 /100 | #222 | Tragic 27.1% |