Senegalese vs Vietnamese Family Households
COMPARE
Senegalese
Vietnamese
Family Households
Family Households Comparison
Senegalese
Vietnamese
59.8%
FAMILY HOUSEHOLDS
0.0/ 100
METRIC RATING
343rd/ 347
METRIC RANK
64.2%
FAMILY HOUSEHOLDS
43.6/ 100
METRIC RATING
176th/ 347
METRIC RANK
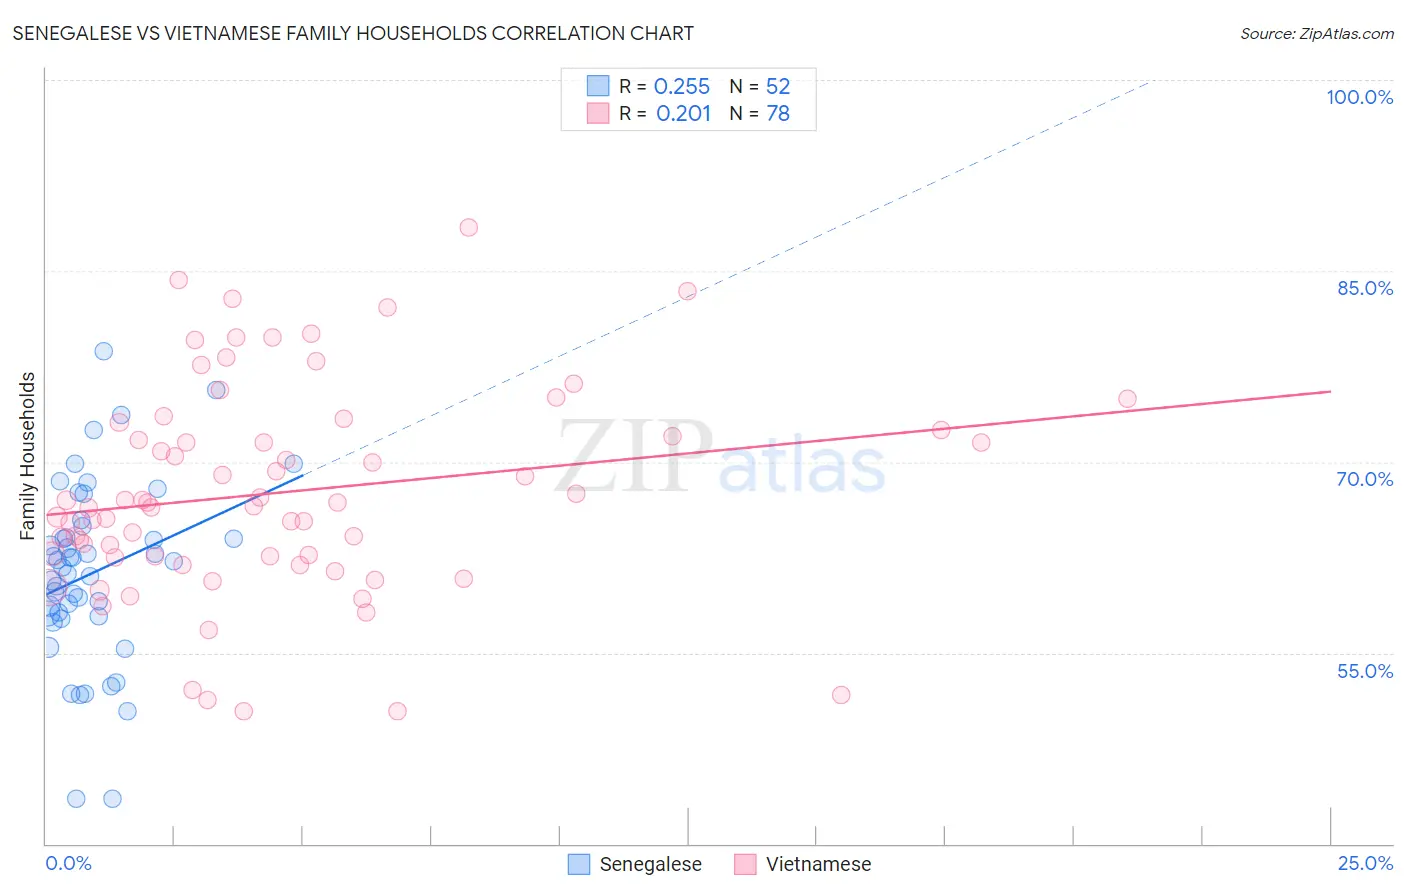
Senegalese vs Vietnamese Family Households Correlation Chart
The statistical analysis conducted on geographies consisting of 78,113,781 people shows a weak positive correlation between the proportion of Senegalese and percentage of family households in the United States with a correlation coefficient (R) of 0.255 and weighted average of 59.8%. Similarly, the statistical analysis conducted on geographies consisting of 170,660,607 people shows a weak positive correlation between the proportion of Vietnamese and percentage of family households in the United States with a correlation coefficient (R) of 0.201 and weighted average of 64.2%, a difference of 7.4%.
Family Households Correlation Summary
| Measurement | Senegalese | Vietnamese |
| Minimum | 43.5% | 50.4% |
| Maximum | 78.7% | 88.4% |
| Range | 35.1% | 38.0% |
| Mean | 61.3% | 67.6% |
| Median | 61.9% | 66.7% |
| Interquartile 25% (IQ1) | 58.0% | 62.6% |
| Interquartile 75% (IQ3) | 64.5% | 72.5% |
| Interquartile Range (IQR) | 6.5% | 9.9% |
| Standard Deviation (Sample) | 7.1% | 8.2% |
| Standard Deviation (Population) | 7.0% | 8.2% |
Similar Demographics by Family Households
Demographics Similar to Senegalese by Family Households
In terms of family households, the demographic groups most similar to Senegalese are Sudanese (60.0%, a difference of 0.30%), Immigrants from Senegal (60.1%, a difference of 0.48%), Immigrants from Sudan (60.2%, a difference of 0.57%), Immigrants from Congo (59.2%, a difference of 0.97%), and Immigrants from Zaire (59.2%, a difference of 1.1%).
| Demographics | Rating | Rank | Family Households |
| Immigrants | Ethiopia | 0.0 /100 | #333 | Tragic 61.2% |
| Immigrants | Eastern Africa | 0.0 /100 | #334 | Tragic 61.1% |
| Carpatho Rusyns | 0.0 /100 | #335 | Tragic 61.1% |
| German Russians | 0.0 /100 | #336 | Tragic 60.9% |
| Soviet Union | 0.0 /100 | #337 | Tragic 60.9% |
| Immigrants | Eritrea | 0.0 /100 | #338 | Tragic 60.8% |
| Immigrants | Saudi Arabia | 0.0 /100 | #339 | Tragic 60.7% |
| Immigrants | Sudan | 0.0 /100 | #340 | Tragic 60.2% |
| Immigrants | Senegal | 0.0 /100 | #341 | Tragic 60.1% |
| Sudanese | 0.0 /100 | #342 | Tragic 60.0% |
| Senegalese | 0.0 /100 | #343 | Tragic 59.8% |
| Immigrants | Congo | 0.0 /100 | #344 | Tragic 59.2% |
| Immigrants | Zaire | 0.0 /100 | #345 | Tragic 59.2% |
| Somalis | 0.0 /100 | #346 | Tragic 57.6% |
| Immigrants | Somalia | 0.0 /100 | #347 | Tragic 56.7% |
Demographics Similar to Vietnamese by Family Households
In terms of family households, the demographic groups most similar to Vietnamese are Bangladeshi (64.3%, a difference of 0.010%), Immigrants from Micronesia (64.2%, a difference of 0.020%), Jamaican (64.2%, a difference of 0.040%), Immigrants from Ukraine (64.2%, a difference of 0.080%), and Immigrants from Germany (64.3%, a difference of 0.090%).
| Demographics | Rating | Rank | Family Households |
| Iraqis | 56.0 /100 | #169 | Average 64.4% |
| Armenians | 55.9 /100 | #170 | Average 64.4% |
| Ute | 54.6 /100 | #171 | Average 64.3% |
| Dutch West Indians | 53.9 /100 | #172 | Average 64.3% |
| Immigrants | Sierra Leone | 52.5 /100 | #173 | Average 64.3% |
| Immigrants | Germany | 50.0 /100 | #174 | Average 64.3% |
| Bangladeshis | 44.3 /100 | #175 | Average 64.3% |
| Vietnamese | 43.6 /100 | #176 | Average 64.2% |
| Immigrants | Micronesia | 42.3 /100 | #177 | Average 64.2% |
| Jamaicans | 40.6 /100 | #178 | Average 64.2% |
| Immigrants | Ukraine | 38.2 /100 | #179 | Fair 64.2% |
| Immigrants | Honduras | 35.0 /100 | #180 | Fair 64.2% |
| Immigrants | Trinidad and Tobago | 34.9 /100 | #181 | Fair 64.2% |
| Ukrainians | 34.6 /100 | #182 | Fair 64.2% |
| Creek | 34.1 /100 | #183 | Fair 64.2% |