Seminole vs Immigrants from Thailand Births to Unmarried Women
COMPARE
Seminole
Immigrants from Thailand
Births to Unmarried Women
Births to Unmarried Women Comparison
Seminole
Immigrants from Thailand
37.9%
BIRTHS TO UNMARRIED WOMEN
0.0/ 100
METRIC RATING
291st/ 347
METRIC RANK
32.8%
BIRTHS TO UNMARRIED WOMEN
18.9/ 100
METRIC RATING
199th/ 347
METRIC RANK
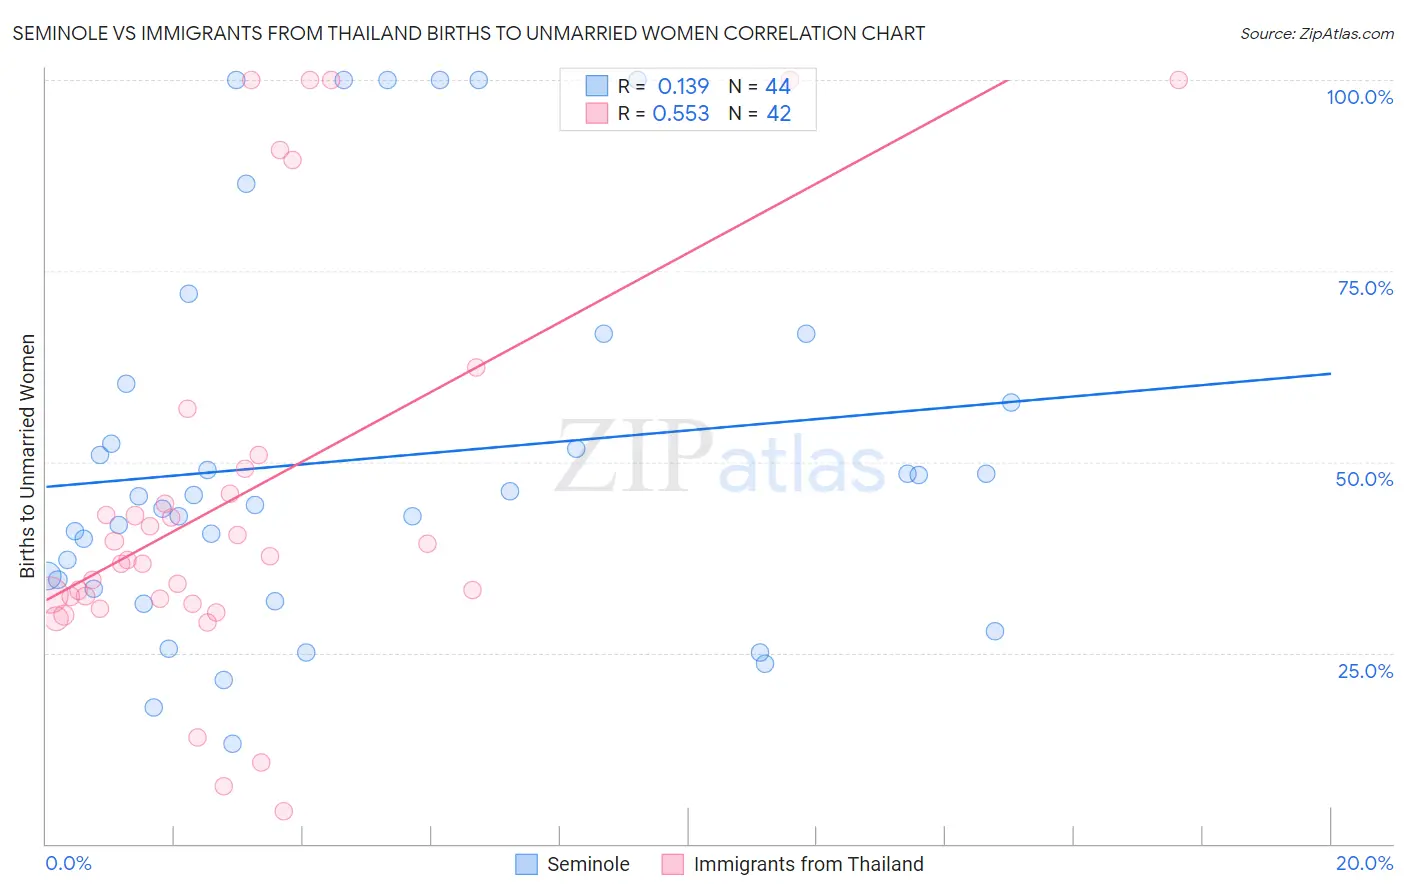
Seminole vs Immigrants from Thailand Births to Unmarried Women Correlation Chart
The statistical analysis conducted on geographies consisting of 116,507,450 people shows a poor positive correlation between the proportion of Seminole and percentage of births to unmarried women in the United States with a correlation coefficient (R) of 0.139 and weighted average of 37.9%. Similarly, the statistical analysis conducted on geographies consisting of 301,314,253 people shows a substantial positive correlation between the proportion of Immigrants from Thailand and percentage of births to unmarried women in the United States with a correlation coefficient (R) of 0.553 and weighted average of 32.8%, a difference of 15.7%.
Births to Unmarried Women Correlation Summary
| Measurement | Seminole | Immigrants from Thailand |
| Minimum | 13.1% | 4.3% |
| Maximum | 100.0% | 100.0% |
| Range | 86.9% | 95.7% |
| Mean | 50.4% | 45.5% |
| Median | 45.0% | 37.5% |
| Interquartile 25% (IQ1) | 34.0% | 32.2% |
| Interquartile 75% (IQ3) | 59.0% | 49.1% |
| Interquartile Range (IQR) | 25.0% | 17.0% |
| Standard Deviation (Sample) | 24.6% | 26.0% |
| Standard Deviation (Population) | 24.3% | 25.7% |
Similar Demographics by Births to Unmarried Women
Demographics Similar to Seminole by Births to Unmarried Women
In terms of births to unmarried women, the demographic groups most similar to Seminole are Blackfeet (37.9%, a difference of 0.050%), Immigrants from Nicaragua (38.0%, a difference of 0.20%), British West Indian (38.0%, a difference of 0.25%), Hispanic or Latino (37.8%, a difference of 0.34%), and Alaskan Athabascan (37.7%, a difference of 0.48%).
| Demographics | Rating | Rank | Births to Unmarried Women |
| Immigrants | Central America | 0.0 /100 | #284 | Tragic 37.4% |
| Immigrants | Mexico | 0.0 /100 | #285 | Tragic 37.5% |
| Immigrants | Guatemala | 0.0 /100 | #286 | Tragic 37.5% |
| Creek | 0.0 /100 | #287 | Tragic 37.6% |
| Immigrants | Liberia | 0.0 /100 | #288 | Tragic 37.6% |
| Alaskan Athabascans | 0.0 /100 | #289 | Tragic 37.7% |
| Hispanics or Latinos | 0.0 /100 | #290 | Tragic 37.8% |
| Seminole | 0.0 /100 | #291 | Tragic 37.9% |
| Blackfeet | 0.0 /100 | #292 | Tragic 37.9% |
| Immigrants | Nicaragua | 0.0 /100 | #293 | Tragic 38.0% |
| British West Indians | 0.0 /100 | #294 | Tragic 38.0% |
| Iroquois | 0.0 /100 | #295 | Tragic 38.2% |
| Alaska Natives | 0.0 /100 | #296 | Tragic 38.3% |
| Dutch West Indians | 0.0 /100 | #297 | Tragic 38.4% |
| Jamaicans | 0.0 /100 | #298 | Tragic 38.5% |
Demographics Similar to Immigrants from Thailand by Births to Unmarried Women
In terms of births to unmarried women, the demographic groups most similar to Immigrants from Thailand are Immigrants from Germany (32.8%, a difference of 0.010%), Costa Rican (32.7%, a difference of 0.20%), Immigrants (32.7%, a difference of 0.25%), Immigrants from Burma/Myanmar (32.9%, a difference of 0.34%), and Immigrants from Micronesia (32.9%, a difference of 0.35%).
| Demographics | Rating | Rank | Births to Unmarried Women |
| Colombians | 31.9 /100 | #192 | Fair 32.2% |
| Fijians | 31.1 /100 | #193 | Fair 32.3% |
| Sudanese | 27.3 /100 | #194 | Fair 32.4% |
| Samoans | 21.9 /100 | #195 | Fair 32.6% |
| Immigrants | Colombia | 21.7 /100 | #196 | Fair 32.6% |
| Immigrants | Immigrants | 20.6 /100 | #197 | Fair 32.7% |
| Costa Ricans | 20.3 /100 | #198 | Fair 32.7% |
| Immigrants | Thailand | 18.9 /100 | #199 | Poor 32.8% |
| Immigrants | Germany | 18.8 /100 | #200 | Poor 32.8% |
| Immigrants | Burma/Myanmar | 16.7 /100 | #201 | Poor 32.9% |
| Immigrants | Micronesia | 16.6 /100 | #202 | Poor 32.9% |
| Ute | 14.4 /100 | #203 | Poor 33.0% |
| Immigrants | Africa | 14.3 /100 | #204 | Poor 33.0% |
| German Russians | 13.1 /100 | #205 | Poor 33.1% |
| Uruguayans | 12.8 /100 | #206 | Poor 33.1% |