Immigrants from South America vs Immigrants from Thailand Births to Unmarried Women
COMPARE
Immigrants from South America
Immigrants from Thailand
Births to Unmarried Women
Births to Unmarried Women Comparison
Immigrants from South America
Immigrants from Thailand
32.0%
BIRTHS TO UNMARRIED WOMEN
40.7/ 100
METRIC RATING
184th/ 347
METRIC RANK
32.8%
BIRTHS TO UNMARRIED WOMEN
18.9/ 100
METRIC RATING
199th/ 347
METRIC RANK
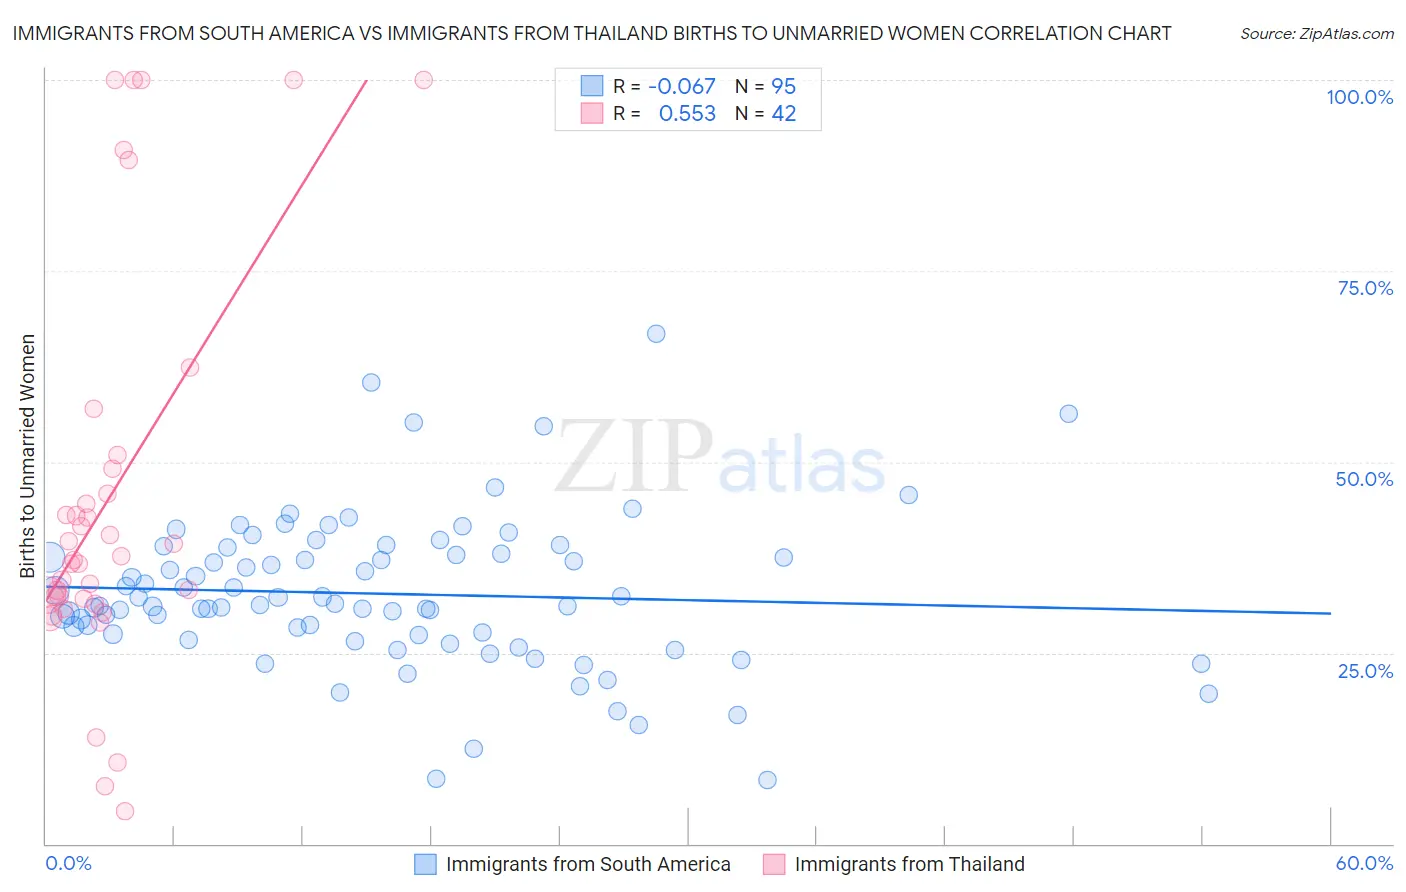
Immigrants from South America vs Immigrants from Thailand Births to Unmarried Women Correlation Chart
The statistical analysis conducted on geographies consisting of 446,269,177 people shows a slight negative correlation between the proportion of Immigrants from South America and percentage of births to unmarried women in the United States with a correlation coefficient (R) of -0.067 and weighted average of 32.0%. Similarly, the statistical analysis conducted on geographies consisting of 301,314,253 people shows a substantial positive correlation between the proportion of Immigrants from Thailand and percentage of births to unmarried women in the United States with a correlation coefficient (R) of 0.553 and weighted average of 32.8%, a difference of 2.5%.
Births to Unmarried Women Correlation Summary
| Measurement | Immigrants from South America | Immigrants from Thailand |
| Minimum | 8.4% | 4.3% |
| Maximum | 66.7% | 100.0% |
| Range | 58.3% | 95.7% |
| Mean | 32.7% | 45.5% |
| Median | 31.3% | 37.5% |
| Interquartile 25% (IQ1) | 27.4% | 32.2% |
| Interquartile 75% (IQ3) | 38.1% | 49.1% |
| Interquartile Range (IQR) | 10.6% | 17.0% |
| Standard Deviation (Sample) | 9.9% | 26.0% |
| Standard Deviation (Population) | 9.9% | 25.7% |
Demographics Similar to Immigrants from South America and Immigrants from Thailand by Births to Unmarried Women
In terms of births to unmarried women, the demographic groups most similar to Immigrants from South America are Canadian (31.9%, a difference of 0.070%), German (32.0%, a difference of 0.11%), Kenyan (31.9%, a difference of 0.23%), Welsh (32.0%, a difference of 0.24%), and Czechoslovakian (32.0%, a difference of 0.26%). Similarly, the demographic groups most similar to Immigrants from Thailand are Immigrants from Germany (32.8%, a difference of 0.010%), Costa Rican (32.7%, a difference of 0.20%), Immigrants (32.7%, a difference of 0.25%), Immigrants from Burma/Myanmar (32.9%, a difference of 0.34%), and Immigrants from Colombia (32.6%, a difference of 0.40%).
| Demographics | Rating | Rank | Births to Unmarried Women |
| Immigrants | Peru | 45.1 /100 | #181 | Average 31.8% |
| Kenyans | 43.0 /100 | #182 | Average 31.9% |
| Canadians | 41.4 /100 | #183 | Average 31.9% |
| Immigrants | South America | 40.7 /100 | #184 | Average 32.0% |
| Germans | 39.5 /100 | #185 | Fair 32.0% |
| Welsh | 38.2 /100 | #186 | Fair 32.0% |
| Czechoslovakians | 38.0 /100 | #187 | Fair 32.0% |
| Osage | 37.1 /100 | #188 | Fair 32.1% |
| Immigrants | Kenya | 36.9 /100 | #189 | Fair 32.1% |
| Tlingit-Haida | 32.6 /100 | #190 | Fair 32.2% |
| Irish | 32.4 /100 | #191 | Fair 32.2% |
| Colombians | 31.9 /100 | #192 | Fair 32.2% |
| Fijians | 31.1 /100 | #193 | Fair 32.3% |
| Sudanese | 27.3 /100 | #194 | Fair 32.4% |
| Samoans | 21.9 /100 | #195 | Fair 32.6% |
| Immigrants | Colombia | 21.7 /100 | #196 | Fair 32.6% |
| Immigrants | Immigrants | 20.6 /100 | #197 | Fair 32.7% |
| Costa Ricans | 20.3 /100 | #198 | Fair 32.7% |
| Immigrants | Thailand | 18.9 /100 | #199 | Poor 32.8% |
| Immigrants | Germany | 18.8 /100 | #200 | Poor 32.8% |
| Immigrants | Burma/Myanmar | 16.7 /100 | #201 | Poor 32.9% |