Immigrants from Philippines vs Immigrants from Thailand Births to Unmarried Women
COMPARE
Immigrants from Philippines
Immigrants from Thailand
Births to Unmarried Women
Births to Unmarried Women Comparison
Immigrants from Philippines
Immigrants from Thailand
30.4%
BIRTHS TO UNMARRIED WOMEN
83.9/ 100
METRIC RATING
137th/ 347
METRIC RANK
32.8%
BIRTHS TO UNMARRIED WOMEN
18.9/ 100
METRIC RATING
199th/ 347
METRIC RANK
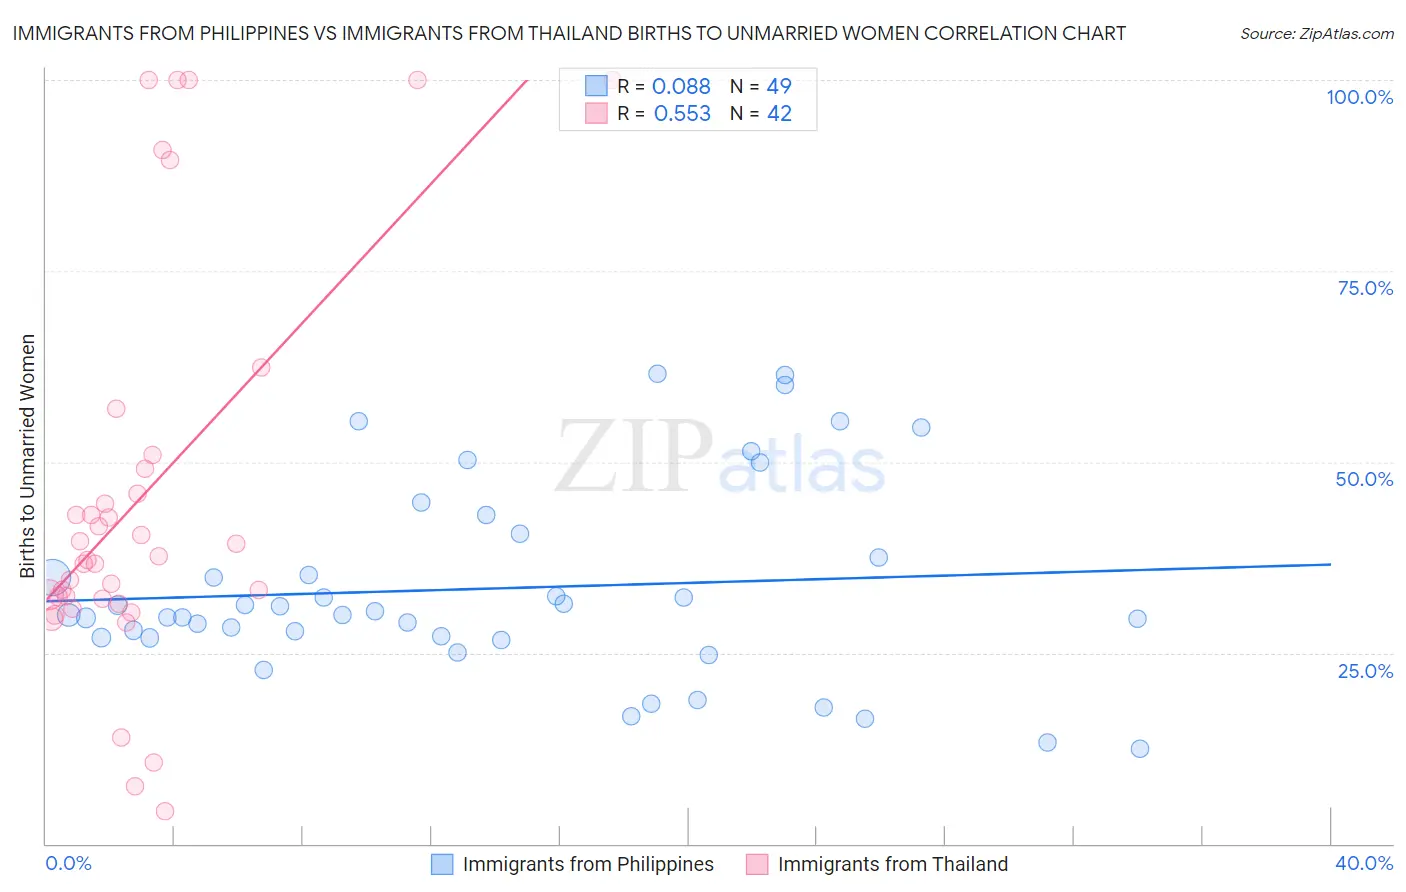
Immigrants from Philippines vs Immigrants from Thailand Births to Unmarried Women Correlation Chart
The statistical analysis conducted on geographies consisting of 435,603,285 people shows a slight positive correlation between the proportion of Immigrants from Philippines and percentage of births to unmarried women in the United States with a correlation coefficient (R) of 0.088 and weighted average of 30.4%. Similarly, the statistical analysis conducted on geographies consisting of 301,314,253 people shows a substantial positive correlation between the proportion of Immigrants from Thailand and percentage of births to unmarried women in the United States with a correlation coefficient (R) of 0.553 and weighted average of 32.8%, a difference of 7.7%.
Births to Unmarried Women Correlation Summary
| Measurement | Immigrants from Philippines | Immigrants from Thailand |
| Minimum | 12.5% | 4.3% |
| Maximum | 61.5% | 100.0% |
| Range | 49.0% | 95.7% |
| Mean | 33.4% | 45.5% |
| Median | 30.0% | 37.5% |
| Interquartile 25% (IQ1) | 27.0% | 32.2% |
| Interquartile 75% (IQ3) | 39.0% | 49.1% |
| Interquartile Range (IQR) | 12.0% | 17.0% |
| Standard Deviation (Sample) | 12.6% | 26.0% |
| Standard Deviation (Population) | 12.5% | 25.7% |
Similar Demographics by Births to Unmarried Women
Demographics Similar to Immigrants from Philippines by Births to Unmarried Women
In terms of births to unmarried women, the demographic groups most similar to Immigrants from Philippines are Puget Sound Salish (30.4%, a difference of 0.0%), Immigrants from Canada (30.4%, a difference of 0.040%), Immigrants from Scotland (30.4%, a difference of 0.13%), Swiss (30.5%, a difference of 0.14%), and Brazilian (30.4%, a difference of 0.16%).
| Demographics | Rating | Rank | Births to Unmarried Women |
| Immigrants | Bosnia and Herzegovina | 85.7 /100 | #130 | Excellent 30.3% |
| Immigrants | Zimbabwe | 85.7 /100 | #131 | Excellent 30.3% |
| New Zealanders | 85.5 /100 | #132 | Excellent 30.3% |
| Immigrants | Morocco | 85.2 /100 | #133 | Excellent 30.4% |
| Immigrants | South Eastern Asia | 85.2 /100 | #134 | Excellent 30.4% |
| Brazilians | 84.8 /100 | #135 | Excellent 30.4% |
| Immigrants | Scotland | 84.6 /100 | #136 | Excellent 30.4% |
| Immigrants | Philippines | 83.9 /100 | #137 | Excellent 30.4% |
| Puget Sound Salish | 83.9 /100 | #138 | Excellent 30.4% |
| Immigrants | Canada | 83.7 /100 | #139 | Excellent 30.4% |
| Swiss | 83.1 /100 | #140 | Excellent 30.5% |
| Pakistanis | 83.0 /100 | #141 | Excellent 30.5% |
| South Africans | 82.7 /100 | #142 | Excellent 30.5% |
| Immigrants | Uganda | 82.6 /100 | #143 | Excellent 30.5% |
| Czechs | 82.1 /100 | #144 | Excellent 30.5% |
Demographics Similar to Immigrants from Thailand by Births to Unmarried Women
In terms of births to unmarried women, the demographic groups most similar to Immigrants from Thailand are Immigrants from Germany (32.8%, a difference of 0.010%), Costa Rican (32.7%, a difference of 0.20%), Immigrants (32.7%, a difference of 0.25%), Immigrants from Burma/Myanmar (32.9%, a difference of 0.34%), and Immigrants from Micronesia (32.9%, a difference of 0.35%).
| Demographics | Rating | Rank | Births to Unmarried Women |
| Colombians | 31.9 /100 | #192 | Fair 32.2% |
| Fijians | 31.1 /100 | #193 | Fair 32.3% |
| Sudanese | 27.3 /100 | #194 | Fair 32.4% |
| Samoans | 21.9 /100 | #195 | Fair 32.6% |
| Immigrants | Colombia | 21.7 /100 | #196 | Fair 32.6% |
| Immigrants | Immigrants | 20.6 /100 | #197 | Fair 32.7% |
| Costa Ricans | 20.3 /100 | #198 | Fair 32.7% |
| Immigrants | Thailand | 18.9 /100 | #199 | Poor 32.8% |
| Immigrants | Germany | 18.8 /100 | #200 | Poor 32.8% |
| Immigrants | Burma/Myanmar | 16.7 /100 | #201 | Poor 32.9% |
| Immigrants | Micronesia | 16.6 /100 | #202 | Poor 32.9% |
| Ute | 14.4 /100 | #203 | Poor 33.0% |
| Immigrants | Africa | 14.3 /100 | #204 | Poor 33.0% |
| German Russians | 13.1 /100 | #205 | Poor 33.1% |
| Uruguayans | 12.8 /100 | #206 | Poor 33.1% |