Scottish vs Slovene Family Households with Children
COMPARE
Scottish
Slovene
Family Households with Children
Family Households with Children Comparison
Scottish
Slovenes
27.0%
FAMILY HOUSEHOLDS WITH CHILDREN
6.5/ 100
METRIC RATING
228th/ 347
METRIC RANK
25.8%
FAMILY HOUSEHOLDS WITH CHILDREN
0.0/ 100
METRIC RATING
331st/ 347
METRIC RANK
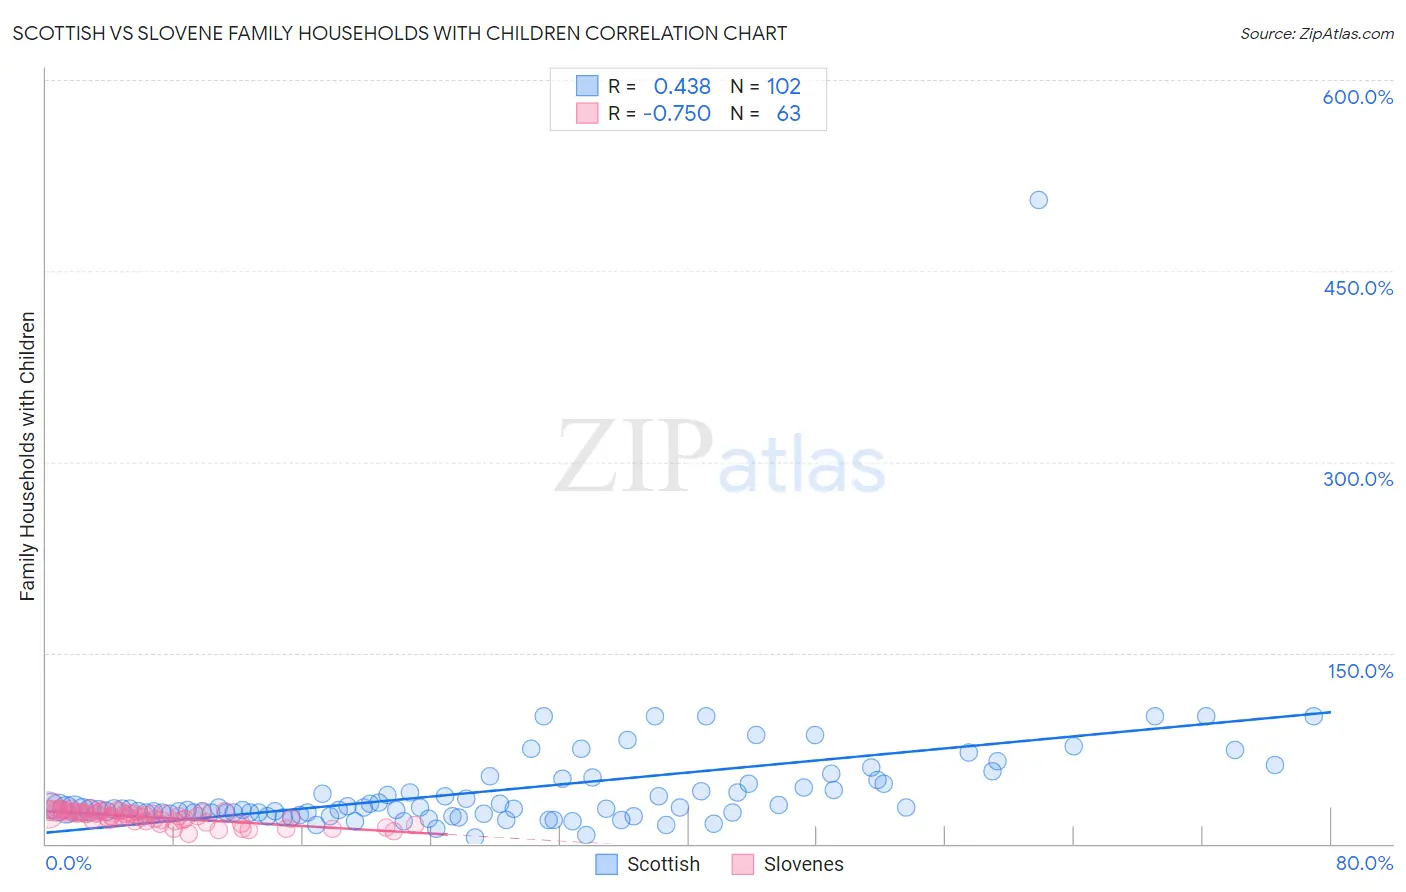
Scottish vs Slovene Family Households with Children Correlation Chart
The statistical analysis conducted on geographies consisting of 566,154,348 people shows a moderate positive correlation between the proportion of Scottish and percentage of family households with children in the United States with a correlation coefficient (R) of 0.438 and weighted average of 27.0%. Similarly, the statistical analysis conducted on geographies consisting of 261,178,360 people shows a strong negative correlation between the proportion of Slovenes and percentage of family households with children in the United States with a correlation coefficient (R) of -0.750 and weighted average of 25.8%, a difference of 4.8%.
Family Households with Children Correlation Summary
| Measurement | Scottish | Slovene |
| Minimum | 5.1% | 7.6% |
| Maximum | 505.5% | 27.9% |
| Range | 500.4% | 20.3% |
| Mean | 42.0% | 20.9% |
| Median | 27.3% | 22.1% |
| Interquartile 25% (IQ1) | 24.2% | 17.8% |
| Interquartile 75% (IQ3) | 47.1% | 25.2% |
| Interquartile Range (IQR) | 22.9% | 7.4% |
| Standard Deviation (Sample) | 51.9% | 5.2% |
| Standard Deviation (Population) | 51.6% | 5.1% |
Similar Demographics by Family Households with Children
Demographics Similar to Scottish by Family Households with Children
In terms of family households with children, the demographic groups most similar to Scottish are Czechoslovakian (27.0%, a difference of 0.0%), Tsimshian (27.0%, a difference of 0.0%), Immigrants from Caribbean (27.0%, a difference of 0.030%), Canadian (27.1%, a difference of 0.080%), and Bulgarian (27.0%, a difference of 0.080%).
| Demographics | Rating | Rank | Family Households with Children |
| New Zealanders | 9.6 /100 | #221 | Tragic 27.1% |
| Paraguayans | 9.4 /100 | #222 | Tragic 27.1% |
| Pima | 9.2 /100 | #223 | Tragic 27.1% |
| Germans | 8.7 /100 | #224 | Tragic 27.1% |
| Canadians | 7.5 /100 | #225 | Tragic 27.1% |
| Czechoslovakians | 6.6 /100 | #226 | Tragic 27.0% |
| Tsimshian | 6.6 /100 | #227 | Tragic 27.0% |
| Scottish | 6.5 /100 | #228 | Tragic 27.0% |
| Immigrants | Caribbean | 6.3 /100 | #229 | Tragic 27.0% |
| Bulgarians | 5.8 /100 | #230 | Tragic 27.0% |
| Luxembourgers | 5.5 /100 | #231 | Tragic 27.0% |
| Yugoslavians | 5.1 /100 | #232 | Tragic 27.0% |
| Immigrants | Italy | 5.0 /100 | #233 | Tragic 27.0% |
| Immigrants | Germany | 4.4 /100 | #234 | Tragic 27.0% |
| Immigrants | Morocco | 4.2 /100 | #235 | Tragic 27.0% |
Demographics Similar to Slovenes by Family Households with Children
In terms of family households with children, the demographic groups most similar to Slovenes are Immigrants from Latvia (25.9%, a difference of 0.13%), Immigrants from Austria (25.8%, a difference of 0.23%), Cypriot (25.9%, a difference of 0.31%), Immigrants from Switzerland (25.7%, a difference of 0.31%), and Immigrants from Albania (25.9%, a difference of 0.44%).
| Demographics | Rating | Rank | Family Households with Children |
| Chinese | 0.0 /100 | #324 | Tragic 26.0% |
| Barbadians | 0.0 /100 | #325 | Tragic 26.0% |
| Immigrants | Ireland | 0.0 /100 | #326 | Tragic 26.0% |
| Immigrants | Barbados | 0.0 /100 | #327 | Tragic 26.0% |
| Immigrants | Albania | 0.0 /100 | #328 | Tragic 25.9% |
| Cypriots | 0.0 /100 | #329 | Tragic 25.9% |
| Immigrants | Latvia | 0.0 /100 | #330 | Tragic 25.9% |
| Slovenes | 0.0 /100 | #331 | Tragic 25.8% |
| Immigrants | Austria | 0.0 /100 | #332 | Tragic 25.8% |
| Immigrants | Switzerland | 0.0 /100 | #333 | Tragic 25.7% |
| Slovaks | 0.0 /100 | #334 | Tragic 25.7% |
| Immigrants | Croatia | 0.0 /100 | #335 | Tragic 25.7% |
| Immigrants | West Indies | 0.0 /100 | #336 | Tragic 25.7% |
| Puerto Ricans | 0.0 /100 | #337 | Tragic 25.6% |
| Arapaho | 0.0 /100 | #338 | Tragic 25.6% |