Immigrants from Western Africa vs Slovene Family Households with Children
COMPARE
Immigrants from Western Africa
Slovene
Family Households with Children
Family Households with Children Comparison
Immigrants from Western Africa
Slovenes
28.3%
FAMILY HOUSEHOLDS WITH CHILDREN
99.6/ 100
METRIC RATING
86th/ 347
METRIC RANK
25.8%
FAMILY HOUSEHOLDS WITH CHILDREN
0.0/ 100
METRIC RATING
331st/ 347
METRIC RANK
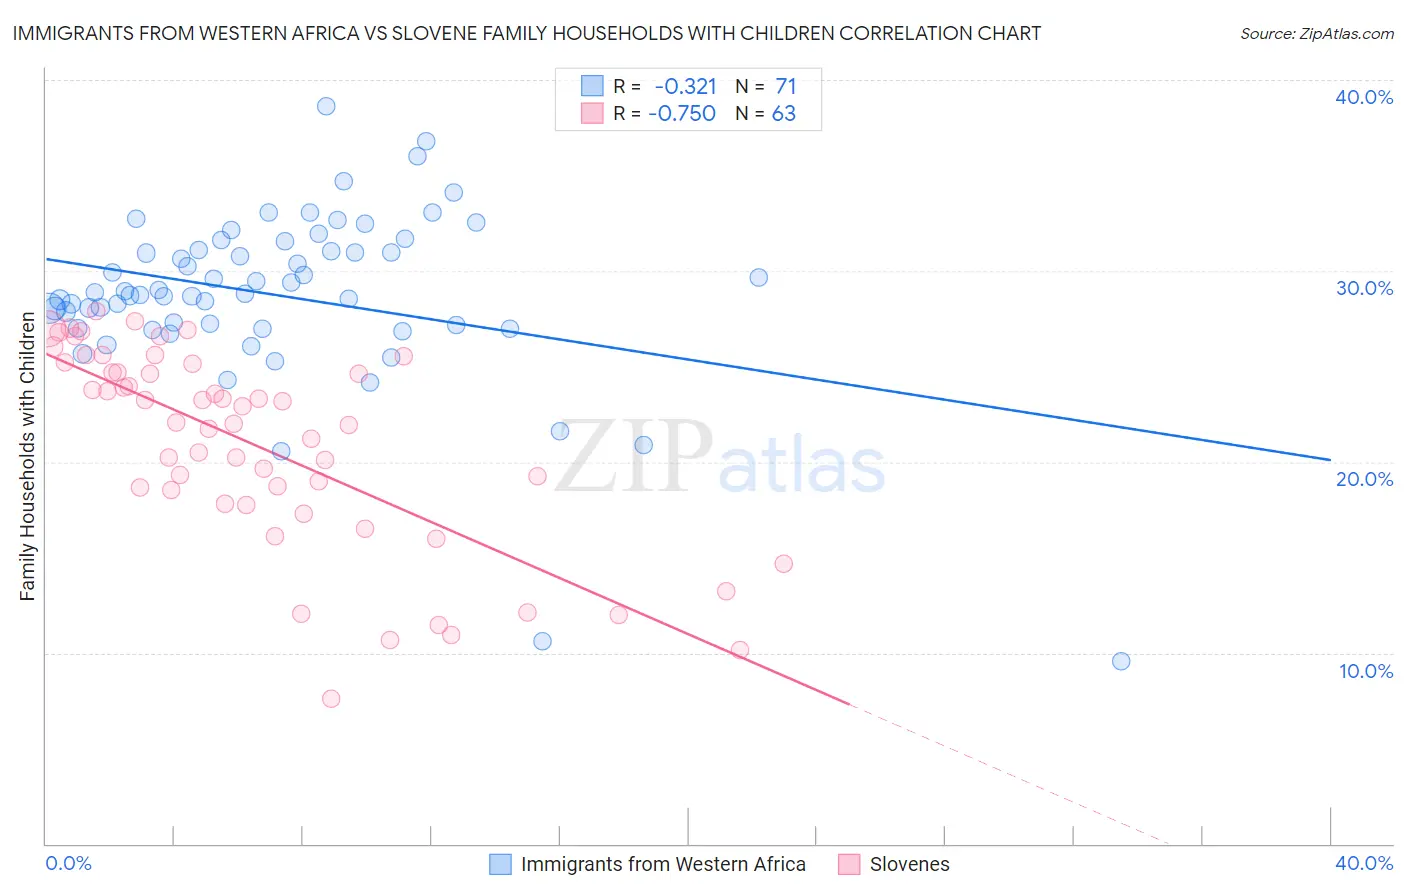
Immigrants from Western Africa vs Slovene Family Households with Children Correlation Chart
The statistical analysis conducted on geographies consisting of 357,382,055 people shows a mild negative correlation between the proportion of Immigrants from Western Africa and percentage of family households with children in the United States with a correlation coefficient (R) of -0.321 and weighted average of 28.3%. Similarly, the statistical analysis conducted on geographies consisting of 261,178,360 people shows a strong negative correlation between the proportion of Slovenes and percentage of family households with children in the United States with a correlation coefficient (R) of -0.750 and weighted average of 25.8%, a difference of 9.6%.
Family Households with Children Correlation Summary
| Measurement | Immigrants from Western Africa | Slovene |
| Minimum | 9.6% | 7.6% |
| Maximum | 38.6% | 27.9% |
| Range | 29.1% | 20.3% |
| Mean | 28.7% | 20.9% |
| Median | 28.8% | 22.1% |
| Interquartile 25% (IQ1) | 27.0% | 17.8% |
| Interquartile 75% (IQ3) | 31.1% | 25.2% |
| Interquartile Range (IQR) | 4.1% | 7.4% |
| Standard Deviation (Sample) | 4.6% | 5.2% |
| Standard Deviation (Population) | 4.6% | 5.1% |
Similar Demographics by Family Households with Children
Demographics Similar to Immigrants from Western Africa by Family Households with Children
In terms of family households with children, the demographic groups most similar to Immigrants from Western Africa are Colombian (28.3%, a difference of 0.060%), Liberian (28.3%, a difference of 0.070%), Immigrants from Costa Rica (28.3%, a difference of 0.080%), Immigrants from Thailand (28.2%, a difference of 0.18%), and Immigrants from Liberia (28.2%, a difference of 0.23%).
| Demographics | Rating | Rank | Family Households with Children |
| Immigrants | Iraq | 99.8 /100 | #79 | Exceptional 28.4% |
| Natives/Alaskans | 99.8 /100 | #80 | Exceptional 28.4% |
| South Americans | 99.8 /100 | #81 | Exceptional 28.4% |
| Kenyans | 99.8 /100 | #82 | Exceptional 28.4% |
| Nicaraguans | 99.8 /100 | #83 | Exceptional 28.4% |
| Costa Ricans | 99.8 /100 | #84 | Exceptional 28.4% |
| Immigrants | Syria | 99.8 /100 | #85 | Exceptional 28.4% |
| Immigrants | Western Africa | 99.6 /100 | #86 | Exceptional 28.3% |
| Colombians | 99.6 /100 | #87 | Exceptional 28.3% |
| Liberians | 99.6 /100 | #88 | Exceptional 28.3% |
| Immigrants | Costa Rica | 99.6 /100 | #89 | Exceptional 28.3% |
| Immigrants | Thailand | 99.5 /100 | #90 | Exceptional 28.2% |
| Immigrants | Liberia | 99.4 /100 | #91 | Exceptional 28.2% |
| Chickasaw | 99.4 /100 | #92 | Exceptional 28.2% |
| Panamanians | 99.3 /100 | #93 | Exceptional 28.2% |
Demographics Similar to Slovenes by Family Households with Children
In terms of family households with children, the demographic groups most similar to Slovenes are Immigrants from Latvia (25.9%, a difference of 0.13%), Immigrants from Austria (25.8%, a difference of 0.23%), Cypriot (25.9%, a difference of 0.31%), Immigrants from Switzerland (25.7%, a difference of 0.31%), and Immigrants from Albania (25.9%, a difference of 0.44%).
| Demographics | Rating | Rank | Family Households with Children |
| Chinese | 0.0 /100 | #324 | Tragic 26.0% |
| Barbadians | 0.0 /100 | #325 | Tragic 26.0% |
| Immigrants | Ireland | 0.0 /100 | #326 | Tragic 26.0% |
| Immigrants | Barbados | 0.0 /100 | #327 | Tragic 26.0% |
| Immigrants | Albania | 0.0 /100 | #328 | Tragic 25.9% |
| Cypriots | 0.0 /100 | #329 | Tragic 25.9% |
| Immigrants | Latvia | 0.0 /100 | #330 | Tragic 25.9% |
| Slovenes | 0.0 /100 | #331 | Tragic 25.8% |
| Immigrants | Austria | 0.0 /100 | #332 | Tragic 25.8% |
| Immigrants | Switzerland | 0.0 /100 | #333 | Tragic 25.7% |
| Slovaks | 0.0 /100 | #334 | Tragic 25.7% |
| Immigrants | Croatia | 0.0 /100 | #335 | Tragic 25.7% |
| Immigrants | West Indies | 0.0 /100 | #336 | Tragic 25.7% |
| Puerto Ricans | 0.0 /100 | #337 | Tragic 25.6% |
| Arapaho | 0.0 /100 | #338 | Tragic 25.6% |