Immigrants from France vs Slovene Family Households with Children
COMPARE
Immigrants from France
Slovene
Family Households with Children
Family Households with Children Comparison
Immigrants from France
Slovenes
26.0%
FAMILY HOUSEHOLDS WITH CHILDREN
0.0/ 100
METRIC RATING
319th/ 347
METRIC RANK
25.8%
FAMILY HOUSEHOLDS WITH CHILDREN
0.0/ 100
METRIC RATING
331st/ 347
METRIC RANK
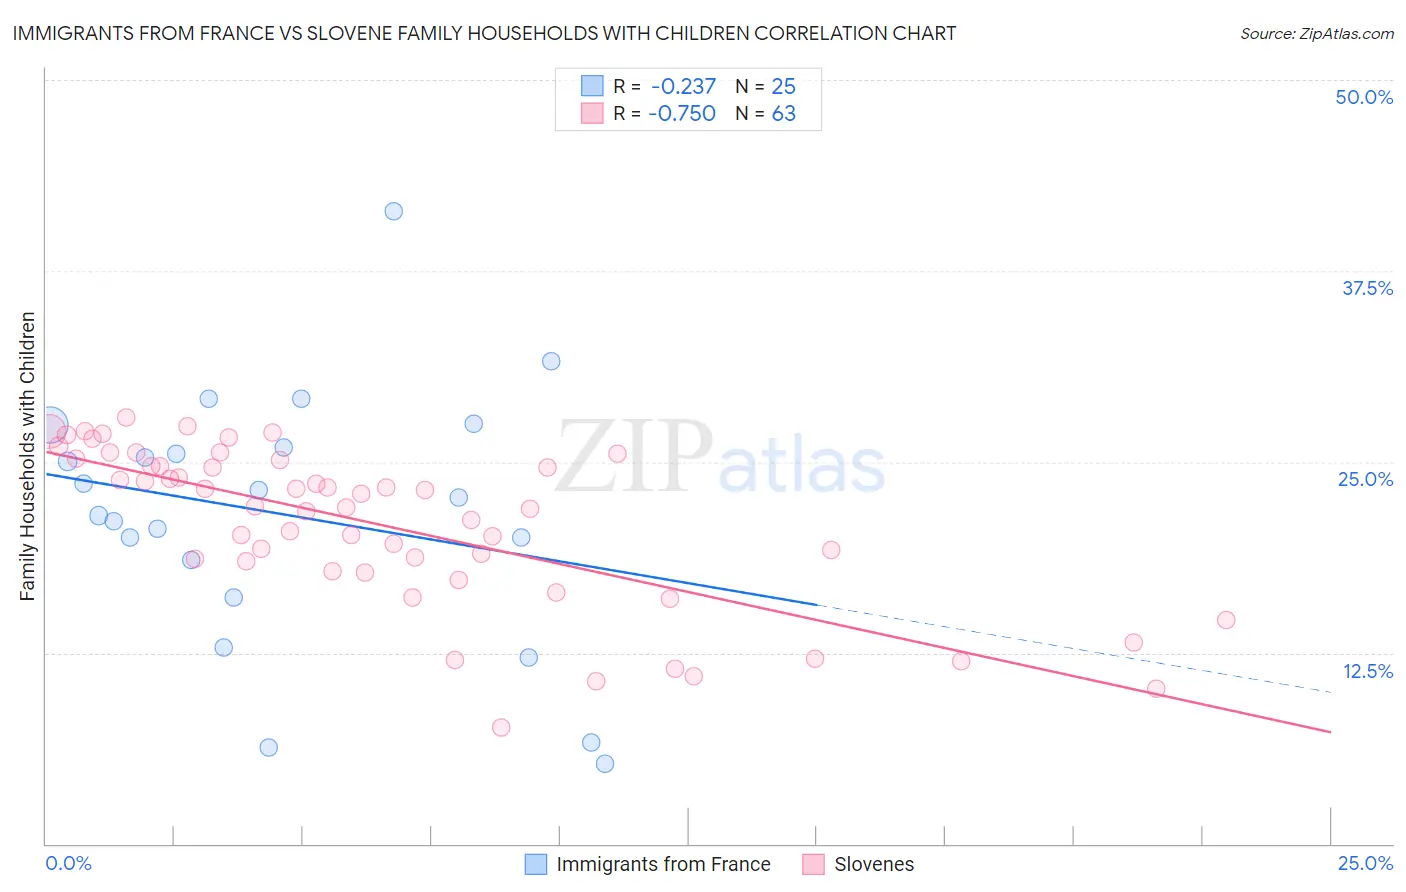
Immigrants from France vs Slovene Family Households with Children Correlation Chart
The statistical analysis conducted on geographies consisting of 287,768,662 people shows a weak negative correlation between the proportion of Immigrants from France and percentage of family households with children in the United States with a correlation coefficient (R) of -0.237 and weighted average of 26.0%. Similarly, the statistical analysis conducted on geographies consisting of 261,178,360 people shows a strong negative correlation between the proportion of Slovenes and percentage of family households with children in the United States with a correlation coefficient (R) of -0.750 and weighted average of 25.8%, a difference of 0.84%.
Family Households with Children Correlation Summary
| Measurement | Immigrants from France | Slovene |
| Minimum | 5.3% | 7.6% |
| Maximum | 41.4% | 27.9% |
| Range | 36.2% | 20.3% |
| Mean | 21.5% | 20.9% |
| Median | 22.7% | 22.1% |
| Interquartile 25% (IQ1) | 17.3% | 17.8% |
| Interquartile 75% (IQ3) | 26.7% | 25.2% |
| Interquartile Range (IQR) | 9.3% | 7.4% |
| Standard Deviation (Sample) | 8.4% | 5.2% |
| Standard Deviation (Population) | 8.2% | 5.1% |
Demographics Similar to Immigrants from France and Slovenes by Family Households with Children
In terms of family households with children, the demographic groups most similar to Immigrants from France are Tlingit-Haida (26.0%, a difference of 0.020%), British West Indian (26.0%, a difference of 0.030%), Immigrants from Greece (26.0%, a difference of 0.040%), Immigrants from Australia (26.0%, a difference of 0.070%), and Iroquois (26.1%, a difference of 0.090%). Similarly, the demographic groups most similar to Slovenes are Immigrants from Latvia (25.9%, a difference of 0.13%), Immigrants from Austria (25.8%, a difference of 0.23%), Cypriot (25.9%, a difference of 0.31%), Immigrants from Switzerland (25.7%, a difference of 0.31%), and Immigrants from Albania (25.9%, a difference of 0.44%).
| Demographics | Rating | Rank | Family Households with Children |
| Immigrants | Norway | 0.0 /100 | #315 | Tragic 26.1% |
| Estonians | 0.0 /100 | #316 | Tragic 26.1% |
| Ottawa | 0.0 /100 | #317 | Tragic 26.1% |
| Iroquois | 0.0 /100 | #318 | Tragic 26.1% |
| Immigrants | France | 0.0 /100 | #319 | Tragic 26.0% |
| Tlingit-Haida | 0.0 /100 | #320 | Tragic 26.0% |
| British West Indians | 0.0 /100 | #321 | Tragic 26.0% |
| Immigrants | Greece | 0.0 /100 | #322 | Tragic 26.0% |
| Immigrants | Australia | 0.0 /100 | #323 | Tragic 26.0% |
| Chinese | 0.0 /100 | #324 | Tragic 26.0% |
| Barbadians | 0.0 /100 | #325 | Tragic 26.0% |
| Immigrants | Ireland | 0.0 /100 | #326 | Tragic 26.0% |
| Immigrants | Barbados | 0.0 /100 | #327 | Tragic 26.0% |
| Immigrants | Albania | 0.0 /100 | #328 | Tragic 25.9% |
| Cypriots | 0.0 /100 | #329 | Tragic 25.9% |
| Immigrants | Latvia | 0.0 /100 | #330 | Tragic 25.9% |
| Slovenes | 0.0 /100 | #331 | Tragic 25.8% |
| Immigrants | Austria | 0.0 /100 | #332 | Tragic 25.8% |
| Immigrants | Switzerland | 0.0 /100 | #333 | Tragic 25.7% |
| Slovaks | 0.0 /100 | #334 | Tragic 25.7% |
| Immigrants | Croatia | 0.0 /100 | #335 | Tragic 25.7% |