Scotch-Irish vs Australian Divorced or Separated
COMPARE
Scotch-Irish
Australian
Divorced or Separated
Divorced or Separated Comparison
Scotch-Irish
Australians
12.9%
DIVORCED OR SEPARATED
0.0/ 100
METRIC RATING
292nd/ 347
METRIC RANK
11.9%
DIVORCED OR SEPARATED
83.6/ 100
METRIC RATING
139th/ 347
METRIC RANK
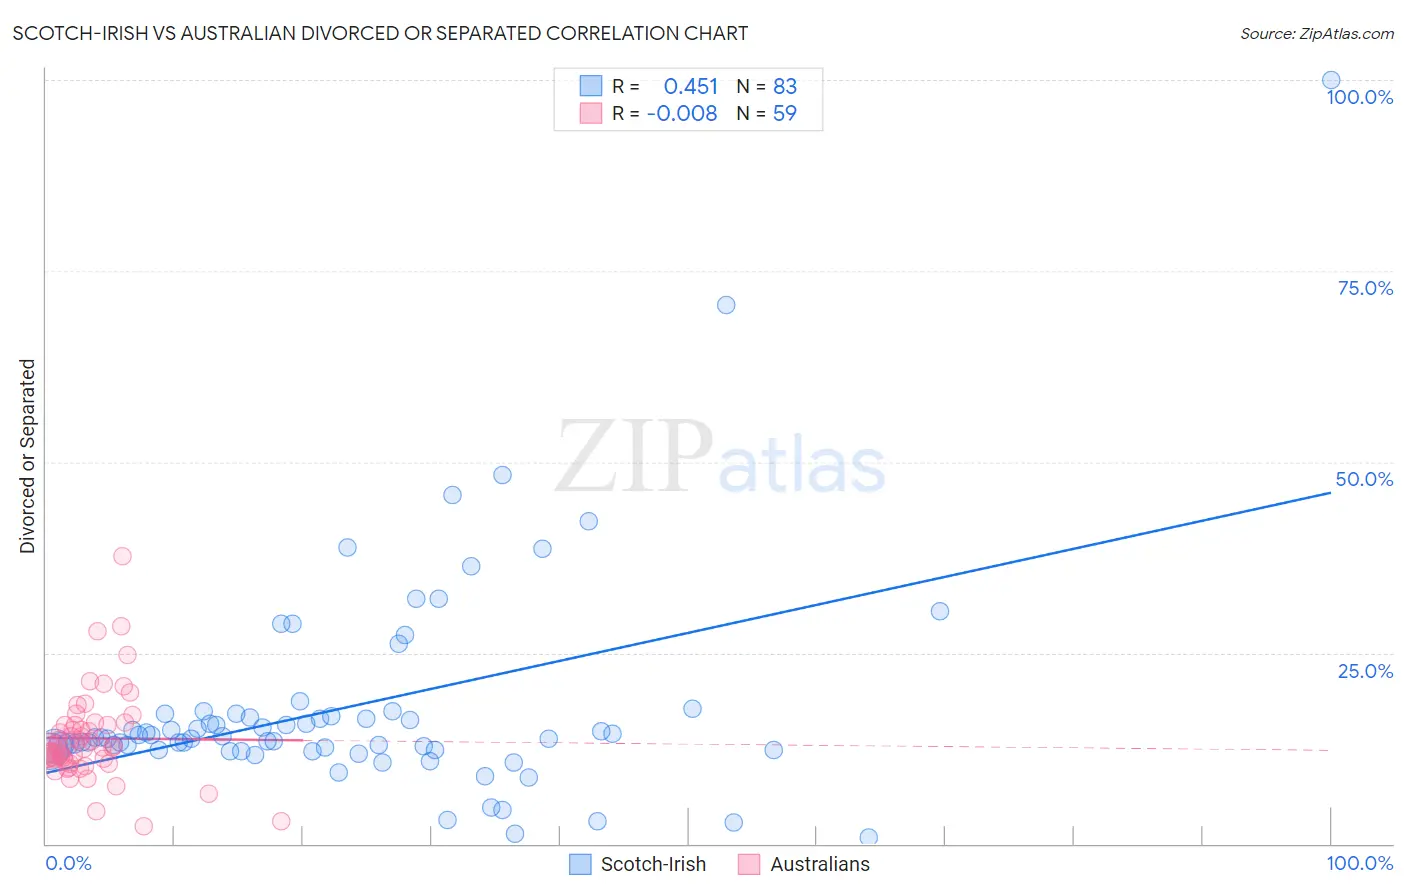
Scotch-Irish vs Australian Divorced or Separated Correlation Chart
The statistical analysis conducted on geographies consisting of 548,485,641 people shows a moderate positive correlation between the proportion of Scotch-Irish and percentage of population currently divorced or separated in the United States with a correlation coefficient (R) of 0.451 and weighted average of 12.9%. Similarly, the statistical analysis conducted on geographies consisting of 224,067,628 people shows no correlation between the proportion of Australians and percentage of population currently divorced or separated in the United States with a correlation coefficient (R) of -0.008 and weighted average of 11.9%, a difference of 8.6%.
Divorced or Separated Correlation Summary
| Measurement | Scotch-Irish | Australian |
| Minimum | 0.80% | 2.3% |
| Maximum | 100.0% | 37.6% |
| Range | 99.2% | 35.3% |
| Mean | 17.9% | 13.8% |
| Median | 13.9% | 12.5% |
| Interquartile 25% (IQ1) | 12.3% | 10.8% |
| Interquartile 75% (IQ3) | 17.0% | 15.6% |
| Interquartile Range (IQR) | 4.7% | 4.9% |
| Standard Deviation (Sample) | 14.3% | 5.9% |
| Standard Deviation (Population) | 14.2% | 5.9% |
Similar Demographics by Divorced or Separated
Demographics Similar to Scotch-Irish by Divorced or Separated
In terms of divorced or separated, the demographic groups most similar to Scotch-Irish are Immigrants from Honduras (12.9%, a difference of 0.060%), Pima (12.9%, a difference of 0.17%), Jamaican (12.9%, a difference of 0.21%), Apache (12.9%, a difference of 0.24%), and Iroquois (12.9%, a difference of 0.32%).
| Demographics | Rating | Rank | Divorced or Separated |
| French | 0.1 /100 | #285 | Tragic 12.8% |
| Spanish | 0.1 /100 | #286 | Tragic 12.8% |
| Hondurans | 0.1 /100 | #287 | Tragic 12.8% |
| French Canadians | 0.1 /100 | #288 | Tragic 12.8% |
| Iroquois | 0.0 /100 | #289 | Tragic 12.9% |
| Pima | 0.0 /100 | #290 | Tragic 12.9% |
| Immigrants | Honduras | 0.0 /100 | #291 | Tragic 12.9% |
| Scotch-Irish | 0.0 /100 | #292 | Tragic 12.9% |
| Jamaicans | 0.0 /100 | #293 | Tragic 12.9% |
| Apache | 0.0 /100 | #294 | Tragic 12.9% |
| Celtics | 0.0 /100 | #295 | Tragic 13.0% |
| Nicaraguans | 0.0 /100 | #296 | Tragic 13.0% |
| Natives/Alaskans | 0.0 /100 | #297 | Tragic 13.0% |
| Venezuelans | 0.0 /100 | #298 | Tragic 13.0% |
| Immigrants | Jamaica | 0.0 /100 | #299 | Tragic 13.0% |
Demographics Similar to Australians by Divorced or Separated
In terms of divorced or separated, the demographic groups most similar to Australians are Alsatian (11.9%, a difference of 0.020%), Immigrants from Netherlands (11.9%, a difference of 0.020%), Lebanese (11.9%, a difference of 0.020%), Immigrants from Morocco (11.9%, a difference of 0.050%), and Danish (11.9%, a difference of 0.080%).
| Demographics | Rating | Rank | Divorced or Separated |
| Immigrants | Afghanistan | 87.9 /100 | #132 | Excellent 11.8% |
| New Zealanders | 87.5 /100 | #133 | Excellent 11.9% |
| Argentineans | 85.1 /100 | #134 | Excellent 11.9% |
| Danes | 84.8 /100 | #135 | Excellent 11.9% |
| Carpatho Rusyns | 84.8 /100 | #136 | Excellent 11.9% |
| Alsatians | 84.0 /100 | #137 | Excellent 11.9% |
| Immigrants | Netherlands | 83.9 /100 | #138 | Excellent 11.9% |
| Australians | 83.6 /100 | #139 | Excellent 11.9% |
| Lebanese | 83.4 /100 | #140 | Excellent 11.9% |
| Immigrants | Morocco | 82.9 /100 | #141 | Excellent 11.9% |
| Immigrants | Zimbabwe | 81.5 /100 | #142 | Excellent 11.9% |
| Pakistanis | 81.3 /100 | #143 | Excellent 11.9% |
| Peruvians | 80.9 /100 | #144 | Excellent 11.9% |
| Croatians | 80.6 /100 | #145 | Excellent 11.9% |
| Immigrants | Grenada | 79.1 /100 | #146 | Good 11.9% |