Sierra Leonean vs Bolivian Currently Married
COMPARE
Sierra Leonean
Bolivian
Currently Married
Currently Married Comparison
Sierra Leoneans
Bolivians
43.4%
CURRENTLY MARRIED
0.1/ 100
METRIC RATING
276th/ 347
METRIC RANK
48.1%
CURRENTLY MARRIED
96.9/ 100
METRIC RATING
83rd/ 347
METRIC RANK
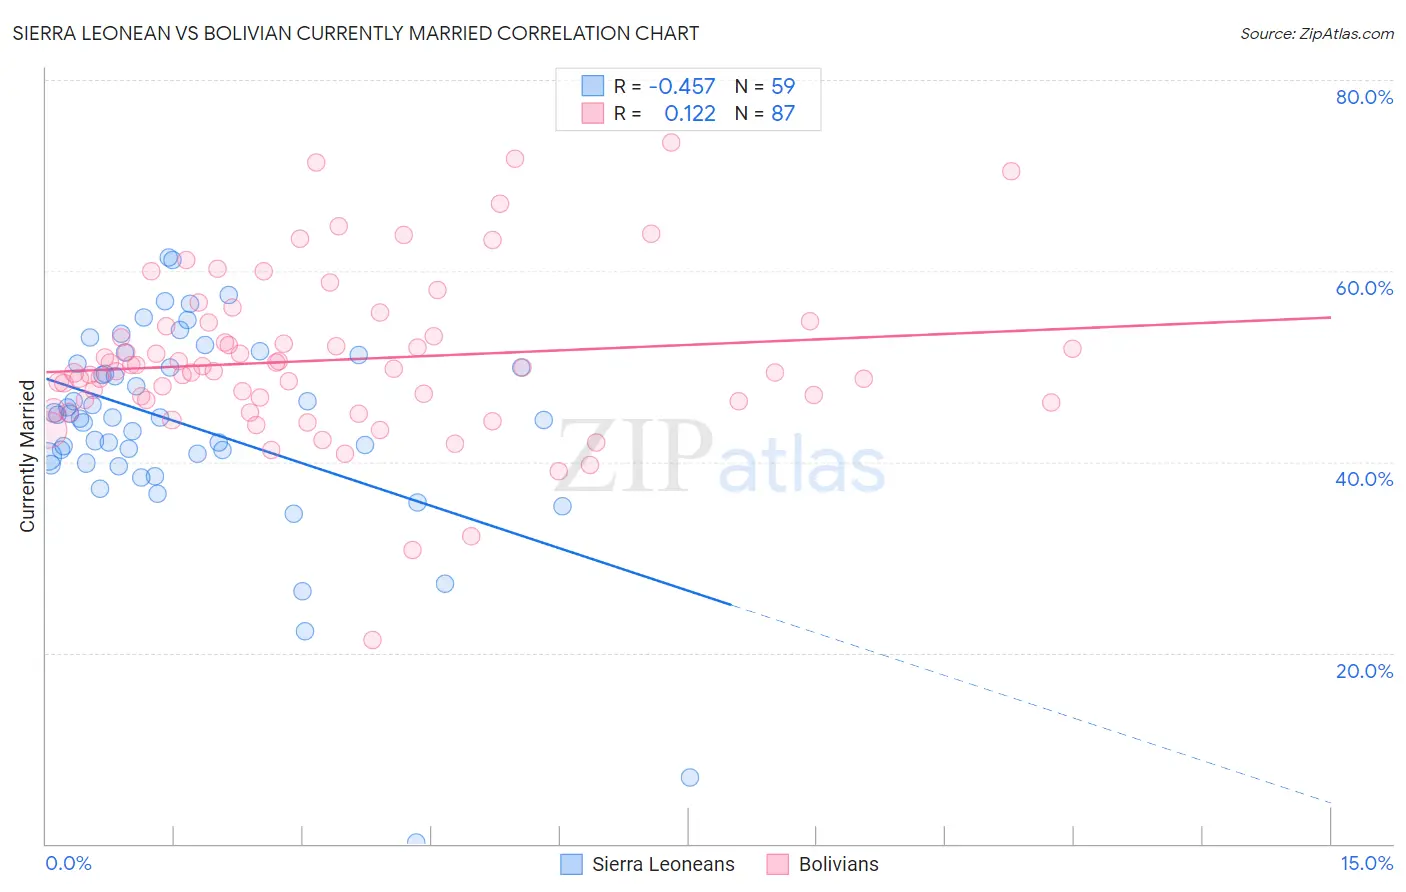
Sierra Leonean vs Bolivian Currently Married Correlation Chart
The statistical analysis conducted on geographies consisting of 83,363,036 people shows a moderate negative correlation between the proportion of Sierra Leoneans and percentage of population currently married in the United States with a correlation coefficient (R) of -0.457 and weighted average of 43.4%. Similarly, the statistical analysis conducted on geographies consisting of 184,673,558 people shows a poor positive correlation between the proportion of Bolivians and percentage of population currently married in the United States with a correlation coefficient (R) of 0.122 and weighted average of 48.1%, a difference of 10.8%.
Currently Married Correlation Summary
| Measurement | Sierra Leonean | Bolivian |
| Minimum | 0.10% | 21.3% |
| Maximum | 61.4% | 73.4% |
| Range | 61.3% | 52.1% |
| Mean | 43.6% | 50.7% |
| Median | 44.7% | 49.6% |
| Interquartile 25% (IQ1) | 39.9% | 46.4% |
| Interquartile 75% (IQ3) | 50.3% | 54.2% |
| Interquartile Range (IQR) | 10.4% | 7.8% |
| Standard Deviation (Sample) | 10.9% | 8.6% |
| Standard Deviation (Population) | 10.8% | 8.6% |
Similar Demographics by Currently Married
Demographics Similar to Sierra Leoneans by Currently Married
In terms of currently married, the demographic groups most similar to Sierra Leoneans are Immigrants from Nigeria (43.4%, a difference of 0.010%), Colville (43.4%, a difference of 0.030%), Nigerian (43.4%, a difference of 0.050%), Yaqui (43.4%, a difference of 0.070%), and Indonesian (43.5%, a difference of 0.11%).
| Demographics | Rating | Rank | Currently Married |
| Immigrants | Sudan | 0.1 /100 | #269 | Tragic 43.5% |
| Salvadorans | 0.1 /100 | #270 | Tragic 43.5% |
| Bermudans | 0.1 /100 | #271 | Tragic 43.5% |
| Indonesians | 0.1 /100 | #272 | Tragic 43.5% |
| Yaqui | 0.1 /100 | #273 | Tragic 43.4% |
| Nigerians | 0.1 /100 | #274 | Tragic 43.4% |
| Colville | 0.1 /100 | #275 | Tragic 43.4% |
| Sierra Leoneans | 0.1 /100 | #276 | Tragic 43.4% |
| Immigrants | Nigeria | 0.1 /100 | #277 | Tragic 43.4% |
| Central Americans | 0.0 /100 | #278 | Tragic 43.3% |
| Central American Indians | 0.0 /100 | #279 | Tragic 43.3% |
| Apache | 0.0 /100 | #280 | Tragic 43.2% |
| Chippewa | 0.0 /100 | #281 | Tragic 43.2% |
| Immigrants | Ecuador | 0.0 /100 | #282 | Tragic 43.2% |
| Kiowa | 0.0 /100 | #283 | Tragic 43.2% |
Demographics Similar to Bolivians by Currently Married
In terms of currently married, the demographic groups most similar to Bolivians are Immigrants from Israel (48.1%, a difference of 0.0%), Immigrants from Poland (48.1%, a difference of 0.010%), Immigrants from Sri Lanka (48.1%, a difference of 0.010%), Immigrants from Europe (48.1%, a difference of 0.010%), and Immigrants from South Africa (48.1%, a difference of 0.050%).
| Demographics | Rating | Rank | Currently Married |
| Basques | 97.2 /100 | #76 | Exceptional 48.1% |
| Slovenes | 97.1 /100 | #77 | Exceptional 48.1% |
| Immigrants | Belgium | 97.1 /100 | #78 | Exceptional 48.1% |
| Immigrants | South Africa | 97.0 /100 | #79 | Exceptional 48.1% |
| Immigrants | Poland | 96.9 /100 | #80 | Exceptional 48.1% |
| Immigrants | Sri Lanka | 96.9 /100 | #81 | Exceptional 48.1% |
| Immigrants | Europe | 96.9 /100 | #82 | Exceptional 48.1% |
| Bolivians | 96.9 /100 | #83 | Exceptional 48.1% |
| Immigrants | Israel | 96.9 /100 | #84 | Exceptional 48.1% |
| French Canadians | 96.3 /100 | #85 | Exceptional 48.0% |
| Immigrants | Japan | 96.2 /100 | #86 | Exceptional 48.0% |
| Jordanians | 96.2 /100 | #87 | Exceptional 48.0% |
| Immigrants | Eastern Europe | 96.1 /100 | #88 | Exceptional 48.0% |
| Indians (Asian) | 95.8 /100 | #89 | Exceptional 48.0% |
| Americans | 95.7 /100 | #90 | Exceptional 48.0% |