Samoan vs Immigrants from Bulgaria Family Households with Children
COMPARE
Samoan
Immigrants from Bulgaria
Family Households with Children
Family Households with Children Comparison
Samoans
Immigrants from Bulgaria
29.5%
FAMILY HOUSEHOLDS WITH CHILDREN
100.0/ 100
METRIC RATING
28th/ 347
METRIC RANK
26.9%
FAMILY HOUSEHOLDS WITH CHILDREN
3.3/ 100
METRIC RATING
240th/ 347
METRIC RANK
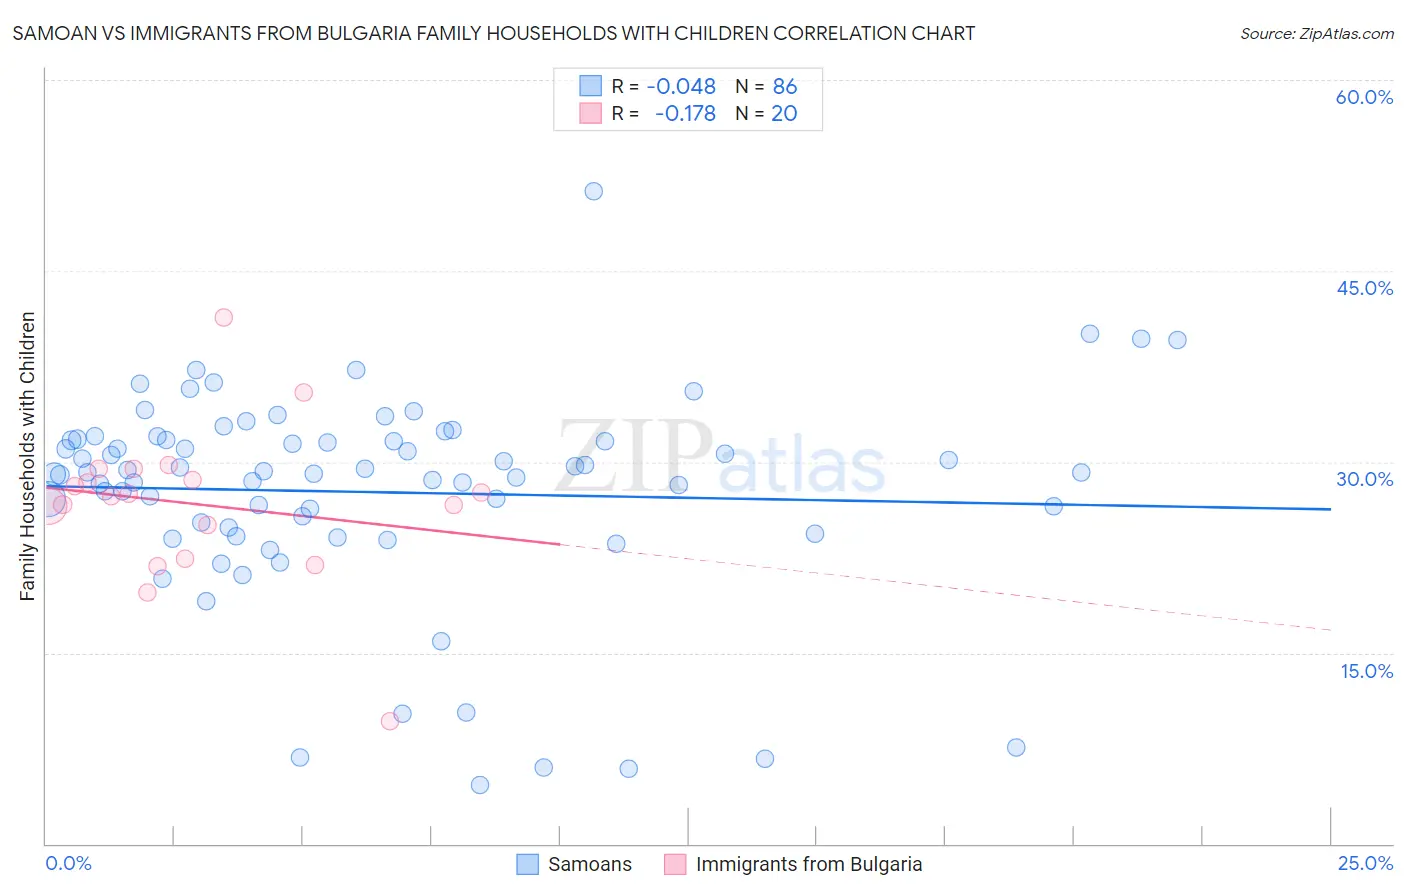
Samoan vs Immigrants from Bulgaria Family Households with Children Correlation Chart
The statistical analysis conducted on geographies consisting of 225,025,987 people shows no correlation between the proportion of Samoans and percentage of family households with children in the United States with a correlation coefficient (R) of -0.048 and weighted average of 29.5%. Similarly, the statistical analysis conducted on geographies consisting of 172,500,518 people shows a poor negative correlation between the proportion of Immigrants from Bulgaria and percentage of family households with children in the United States with a correlation coefficient (R) of -0.178 and weighted average of 26.9%, a difference of 9.5%.
Family Households with Children Correlation Summary
| Measurement | Samoan | Immigrants from Bulgaria |
| Minimum | 4.6% | 9.6% |
| Maximum | 51.3% | 41.4% |
| Range | 46.7% | 31.7% |
| Mean | 27.6% | 26.7% |
| Median | 29.2% | 27.4% |
| Interquartile 25% (IQ1) | 24.8% | 23.7% |
| Interquartile 75% (IQ3) | 31.8% | 29.0% |
| Interquartile Range (IQR) | 6.9% | 5.3% |
| Standard Deviation (Sample) | 8.3% | 6.2% |
| Standard Deviation (Population) | 8.2% | 6.1% |
Similar Demographics by Family Households with Children
Demographics Similar to Samoans by Family Households with Children
In terms of family households with children, the demographic groups most similar to Samoans are Bolivian (29.5%, a difference of 0.0%), Yuman (29.5%, a difference of 0.040%), Immigrants from Vietnam (29.5%, a difference of 0.16%), Sri Lankan (29.5%, a difference of 0.18%), and Japanese (29.4%, a difference of 0.18%).
| Demographics | Rating | Rank | Family Households with Children |
| Immigrants | Laos | 100.0 /100 | #21 | Exceptional 29.8% |
| Malaysians | 100.0 /100 | #22 | Exceptional 29.8% |
| Mexican American Indians | 100.0 /100 | #23 | Exceptional 29.7% |
| Guamanians/Chamorros | 100.0 /100 | #24 | Exceptional 29.7% |
| Immigrants | Latin America | 100.0 /100 | #25 | Exceptional 29.7% |
| Sri Lankans | 100.0 /100 | #26 | Exceptional 29.5% |
| Immigrants | Vietnam | 100.0 /100 | #27 | Exceptional 29.5% |
| Samoans | 100.0 /100 | #28 | Exceptional 29.5% |
| Bolivians | 100.0 /100 | #29 | Exceptional 29.5% |
| Yuman | 100.0 /100 | #30 | Exceptional 29.5% |
| Japanese | 100.0 /100 | #31 | Exceptional 29.4% |
| Immigrants | Yemen | 100.0 /100 | #32 | Exceptional 29.4% |
| Venezuelans | 100.0 /100 | #33 | Exceptional 29.4% |
| Immigrants | Bolivia | 100.0 /100 | #34 | Exceptional 29.3% |
| Immigrants | Sierra Leone | 100.0 /100 | #35 | Exceptional 29.3% |
Demographics Similar to Immigrants from Bulgaria by Family Households with Children
In terms of family households with children, the demographic groups most similar to Immigrants from Bulgaria are Navajo (26.9%, a difference of 0.010%), Immigrants from England (26.9%, a difference of 0.010%), Moroccan (26.9%, a difference of 0.020%), Immigrants from Southern Europe (26.9%, a difference of 0.020%), and Immigrants from Netherlands (26.9%, a difference of 0.030%).
| Demographics | Rating | Rank | Family Households with Children |
| Immigrants | Italy | 5.0 /100 | #233 | Tragic 27.0% |
| Immigrants | Germany | 4.4 /100 | #234 | Tragic 27.0% |
| Immigrants | Morocco | 4.2 /100 | #235 | Tragic 27.0% |
| Cape Verdeans | 3.6 /100 | #236 | Tragic 26.9% |
| Immigrants | Netherlands | 3.5 /100 | #237 | Tragic 26.9% |
| Moroccans | 3.4 /100 | #238 | Tragic 26.9% |
| Immigrants | Southern Europe | 3.4 /100 | #239 | Tragic 26.9% |
| Immigrants | Bulgaria | 3.3 /100 | #240 | Tragic 26.9% |
| Navajo | 3.2 /100 | #241 | Tragic 26.9% |
| Immigrants | England | 3.2 /100 | #242 | Tragic 26.9% |
| Immigrants | Saudi Arabia | 2.9 /100 | #243 | Tragic 26.9% |
| Ukrainians | 2.9 /100 | #244 | Tragic 26.9% |
| Australians | 2.8 /100 | #245 | Tragic 26.9% |
| Jamaicans | 2.5 /100 | #246 | Tragic 26.9% |
| Potawatomi | 2.2 /100 | #247 | Tragic 26.9% |