Immigrants from Cambodia vs Seminole Family Households with Children
COMPARE
Immigrants from Cambodia
Seminole
Family Households with Children
Family Households with Children Comparison
Immigrants from Cambodia
Seminole
28.9%
FAMILY HOUSEHOLDS WITH CHILDREN
100.0/ 100
METRIC RATING
53rd/ 347
METRIC RANK
27.5%
FAMILY HOUSEHOLDS WITH CHILDREN
56.9/ 100
METRIC RATING
169th/ 347
METRIC RANK
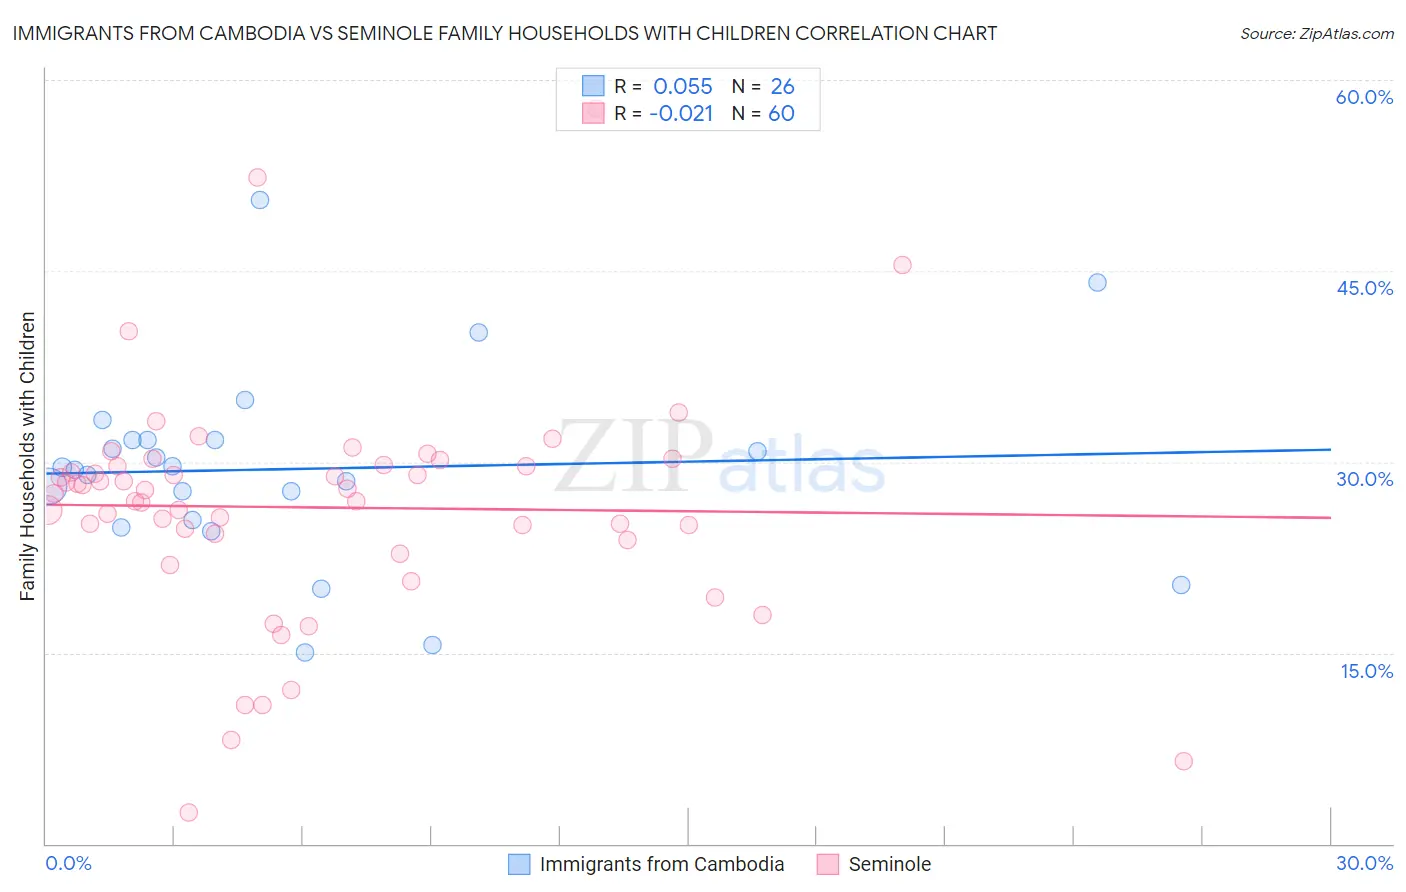
Immigrants from Cambodia vs Seminole Family Households with Children Correlation Chart
The statistical analysis conducted on geographies consisting of 205,128,905 people shows a slight positive correlation between the proportion of Immigrants from Cambodia and percentage of family households with children in the United States with a correlation coefficient (R) of 0.055 and weighted average of 28.9%. Similarly, the statistical analysis conducted on geographies consisting of 118,297,441 people shows no correlation between the proportion of Seminole and percentage of family households with children in the United States with a correlation coefficient (R) of -0.021 and weighted average of 27.5%, a difference of 5.1%.
Family Households with Children Correlation Summary
| Measurement | Immigrants from Cambodia | Seminole |
| Minimum | 15.0% | 2.4% |
| Maximum | 50.6% | 57.7% |
| Range | 35.6% | 55.3% |
| Mean | 29.4% | 26.4% |
| Median | 29.5% | 27.6% |
| Interquartile 25% (IQ1) | 25.4% | 24.1% |
| Interquartile 75% (IQ3) | 31.7% | 29.7% |
| Interquartile Range (IQR) | 6.3% | 5.6% |
| Standard Deviation (Sample) | 7.7% | 9.2% |
| Standard Deviation (Population) | 7.5% | 9.2% |
Similar Demographics by Family Households with Children
Demographics Similar to Immigrants from Cambodia by Family Households with Children
In terms of family households with children, the demographic groups most similar to Immigrants from Cambodia are Guatemalan (28.9%, a difference of 0.070%), Sierra Leonean (28.9%, a difference of 0.080%), Immigrants from Asia (28.8%, a difference of 0.14%), Immigrants from Peru (28.9%, a difference of 0.15%), and Immigrants (28.9%, a difference of 0.19%).
| Demographics | Rating | Rank | Family Households with Children |
| Immigrants | Philippines | 100.0 /100 | #46 | Exceptional 29.0% |
| Peruvians | 100.0 /100 | #47 | Exceptional 29.0% |
| Apache | 100.0 /100 | #48 | Exceptional 29.0% |
| Jordanians | 100.0 /100 | #49 | Exceptional 29.0% |
| Immigrants | Immigrants | 100.0 /100 | #50 | Exceptional 28.9% |
| Immigrants | Peru | 100.0 /100 | #51 | Exceptional 28.9% |
| Guatemalans | 100.0 /100 | #52 | Exceptional 28.9% |
| Immigrants | Cambodia | 100.0 /100 | #53 | Exceptional 28.9% |
| Sierra Leoneans | 100.0 /100 | #54 | Exceptional 28.9% |
| Immigrants | Asia | 100.0 /100 | #55 | Exceptional 28.8% |
| Immigrants | Guatemala | 100.0 /100 | #56 | Exceptional 28.8% |
| Danes | 100.0 /100 | #57 | Exceptional 28.7% |
| Hawaiians | 100.0 /100 | #58 | Exceptional 28.7% |
| Immigrants | Nigeria | 100.0 /100 | #59 | Exceptional 28.6% |
| Hmong | 99.9 /100 | #60 | Exceptional 28.6% |
Demographics Similar to Seminole by Family Households with Children
In terms of family households with children, the demographic groups most similar to Seminole are Cherokee (27.5%, a difference of 0.0%), Blackfeet (27.5%, a difference of 0.060%), Israeli (27.5%, a difference of 0.070%), Immigrants from Kuwait (27.5%, a difference of 0.090%), and Immigrants from South Africa (27.5%, a difference of 0.10%).
| Demographics | Rating | Rank | Family Households with Children |
| Immigrants | Bangladesh | 67.0 /100 | #162 | Good 27.6% |
| Czechs | 65.3 /100 | #163 | Good 27.5% |
| Immigrants | Hong Kong | 64.9 /100 | #164 | Good 27.5% |
| Immigrants | South Africa | 61.3 /100 | #165 | Good 27.5% |
| Immigrants | Nonimmigrants | 61.2 /100 | #166 | Good 27.5% |
| Dominicans | 61.1 /100 | #167 | Good 27.5% |
| Immigrants | Kuwait | 60.9 /100 | #168 | Good 27.5% |
| Seminole | 56.9 /100 | #169 | Average 27.5% |
| Cherokee | 56.7 /100 | #170 | Average 27.5% |
| Blackfeet | 54.3 /100 | #171 | Average 27.5% |
| Israelis | 53.9 /100 | #172 | Average 27.5% |
| Immigrants | Argentina | 52.2 /100 | #173 | Average 27.5% |
| Whites/Caucasians | 50.0 /100 | #174 | Average 27.4% |
| British | 49.9 /100 | #175 | Average 27.4% |
| Immigrants | China | 49.6 /100 | #176 | Average 27.4% |