Samoan vs Maltese Single Father Households
COMPARE
Samoan
Maltese
Single Father Households
Single Father Households Comparison
Samoans
Maltese
2.6%
SINGLE FATHER HOUSEHOLDS
0.1/ 100
METRIC RATING
279th/ 347
METRIC RANK
2.0%
SINGLE FATHER HOUSEHOLDS
99.9/ 100
METRIC RATING
63rd/ 347
METRIC RANK
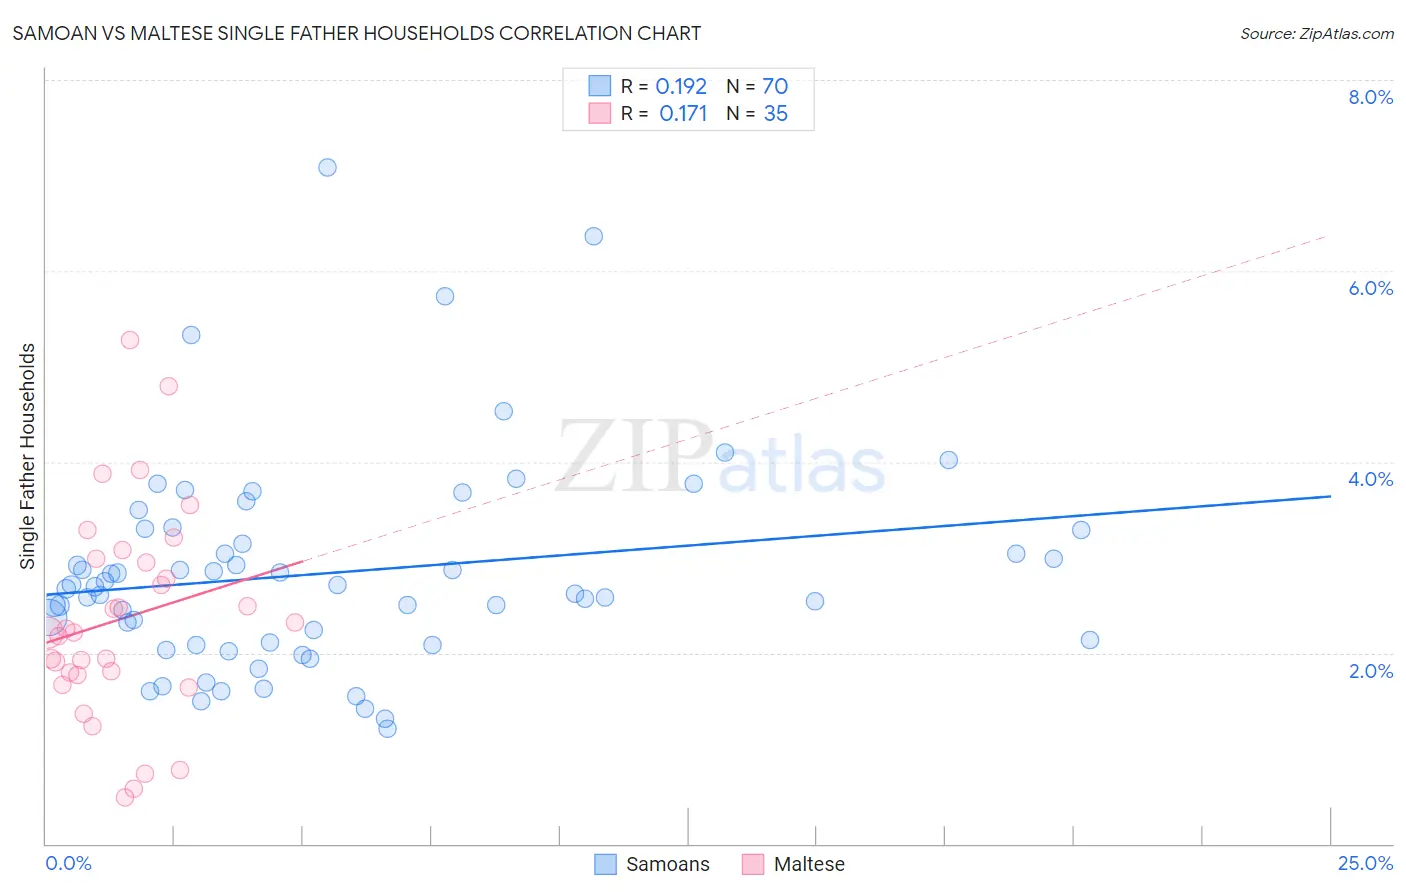
Samoan vs Maltese Single Father Households Correlation Chart
The statistical analysis conducted on geographies consisting of 224,300,903 people shows a poor positive correlation between the proportion of Samoans and percentage of single father households in the United States with a correlation coefficient (R) of 0.192 and weighted average of 2.6%. Similarly, the statistical analysis conducted on geographies consisting of 125,770,300 people shows a poor positive correlation between the proportion of Maltese and percentage of single father households in the United States with a correlation coefficient (R) of 0.171 and weighted average of 2.0%, a difference of 28.1%.
Single Father Households Correlation Summary
| Measurement | Samoan | Maltese |
| Minimum | 1.2% | 0.48% |
| Maximum | 7.1% | 5.3% |
| Range | 5.9% | 4.8% |
| Mean | 2.8% | 2.4% |
| Median | 2.7% | 2.2% |
| Interquartile 25% (IQ1) | 2.1% | 1.8% |
| Interquartile 75% (IQ3) | 3.3% | 3.0% |
| Interquartile Range (IQR) | 1.2% | 1.2% |
| Standard Deviation (Sample) | 1.1% | 1.1% |
| Standard Deviation (Population) | 1.1% | 1.1% |
Similar Demographics by Single Father Households
Demographics Similar to Samoans by Single Father Households
In terms of single father households, the demographic groups most similar to Samoans are Cherokee (2.6%, a difference of 0.040%), Shoshone (2.6%, a difference of 0.090%), Immigrants from Haiti (2.6%, a difference of 0.12%), Immigrants from Dominican Republic (2.6%, a difference of 0.33%), and Immigrants from Portugal (2.6%, a difference of 0.55%).
| Demographics | Rating | Rank | Single Father Households |
| Belizeans | 0.2 /100 | #272 | Tragic 2.6% |
| Iroquois | 0.2 /100 | #273 | Tragic 2.6% |
| Puerto Ricans | 0.2 /100 | #274 | Tragic 2.6% |
| Immigrants | Dominican Republic | 0.2 /100 | #275 | Tragic 2.6% |
| Immigrants | Haiti | 0.1 /100 | #276 | Tragic 2.6% |
| Shoshone | 0.1 /100 | #277 | Tragic 2.6% |
| Cherokee | 0.1 /100 | #278 | Tragic 2.6% |
| Samoans | 0.1 /100 | #279 | Tragic 2.6% |
| Immigrants | Portugal | 0.1 /100 | #280 | Tragic 2.6% |
| Nicaraguans | 0.1 /100 | #281 | Tragic 2.6% |
| Dutch West Indians | 0.1 /100 | #282 | Tragic 2.6% |
| Immigrants | Nicaragua | 0.1 /100 | #283 | Tragic 2.7% |
| Hawaiians | 0.1 /100 | #284 | Tragic 2.7% |
| Ottawa | 0.1 /100 | #285 | Tragic 2.7% |
| Immigrants | Cuba | 0.1 /100 | #286 | Tragic 2.7% |
Demographics Similar to Maltese by Single Father Households
In terms of single father households, the demographic groups most similar to Maltese are Mongolian (2.1%, a difference of 0.14%), Paraguayan (2.1%, a difference of 0.17%), Immigrants from Malaysia (2.0%, a difference of 0.20%), Vietnamese (2.0%, a difference of 0.39%), and Immigrants from Western Asia (2.1%, a difference of 0.53%).
| Demographics | Rating | Rank | Single Father Households |
| Immigrants | Norway | 99.9 /100 | #56 | Exceptional 2.0% |
| Burmese | 99.9 /100 | #57 | Exceptional 2.0% |
| Immigrants | Czechoslovakia | 99.9 /100 | #58 | Exceptional 2.0% |
| Immigrants | North Macedonia | 99.9 /100 | #59 | Exceptional 2.0% |
| Immigrants | Austria | 99.9 /100 | #60 | Exceptional 2.0% |
| Vietnamese | 99.9 /100 | #61 | Exceptional 2.0% |
| Immigrants | Malaysia | 99.9 /100 | #62 | Exceptional 2.0% |
| Maltese | 99.9 /100 | #63 | Exceptional 2.0% |
| Mongolians | 99.9 /100 | #64 | Exceptional 2.1% |
| Paraguayans | 99.9 /100 | #65 | Exceptional 2.1% |
| Immigrants | Western Asia | 99.8 /100 | #66 | Exceptional 2.1% |
| Immigrants | Italy | 99.8 /100 | #67 | Exceptional 2.1% |
| Immigrants | Denmark | 99.8 /100 | #68 | Exceptional 2.1% |
| Immigrants | Romania | 99.8 /100 | #69 | Exceptional 2.1% |
| Egyptians | 99.8 /100 | #70 | Exceptional 2.1% |