Samoan vs Indian (Asian) Single Father Households
COMPARE
Samoan
Indian (Asian)
Single Father Households
Single Father Households Comparison
Samoans
Indians (Asian)
2.6%
SINGLE FATHER HOUSEHOLDS
0.1/ 100
METRIC RATING
279th/ 347
METRIC RANK
1.9%
SINGLE FATHER HOUSEHOLDS
100.0/ 100
METRIC RATING
18th/ 347
METRIC RANK
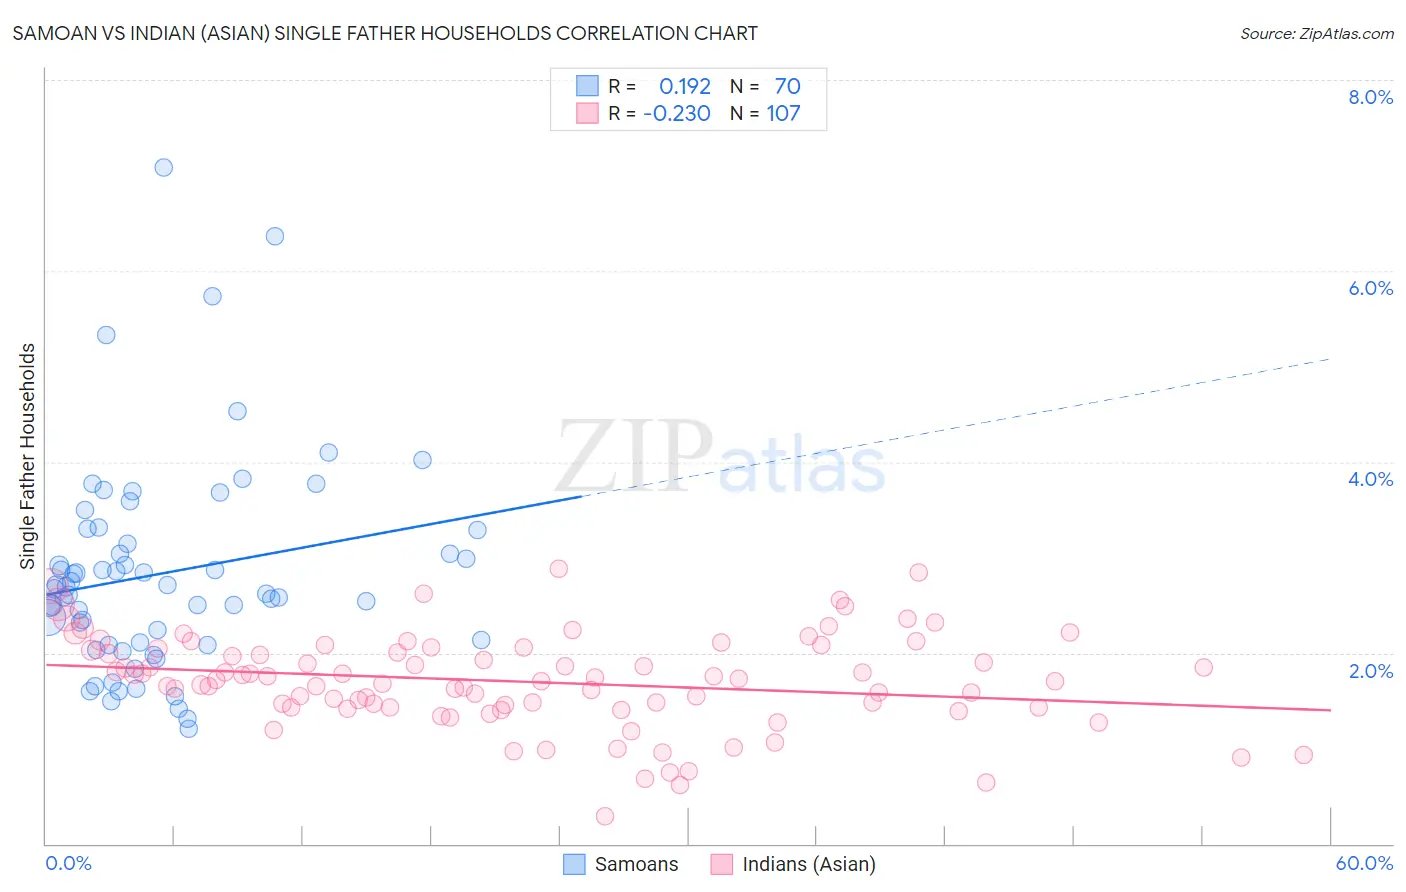
Samoan vs Indian (Asian) Single Father Households Correlation Chart
The statistical analysis conducted on geographies consisting of 224,300,903 people shows a poor positive correlation between the proportion of Samoans and percentage of single father households in the United States with a correlation coefficient (R) of 0.192 and weighted average of 2.6%. Similarly, the statistical analysis conducted on geographies consisting of 488,421,643 people shows a weak negative correlation between the proportion of Indians (Asian) and percentage of single father households in the United States with a correlation coefficient (R) of -0.230 and weighted average of 1.9%, a difference of 37.7%.
Single Father Households Correlation Summary
| Measurement | Samoan | Indian (Asian) |
| Minimum | 1.2% | 0.29% |
| Maximum | 7.1% | 2.9% |
| Range | 5.9% | 2.6% |
| Mean | 2.8% | 1.7% |
| Median | 2.7% | 1.7% |
| Interquartile 25% (IQ1) | 2.1% | 1.4% |
| Interquartile 75% (IQ3) | 3.3% | 2.0% |
| Interquartile Range (IQR) | 1.2% | 0.61% |
| Standard Deviation (Sample) | 1.1% | 0.49% |
| Standard Deviation (Population) | 1.1% | 0.49% |
Similar Demographics by Single Father Households
Demographics Similar to Samoans by Single Father Households
In terms of single father households, the demographic groups most similar to Samoans are Cherokee (2.6%, a difference of 0.040%), Shoshone (2.6%, a difference of 0.090%), Immigrants from Haiti (2.6%, a difference of 0.12%), Immigrants from Dominican Republic (2.6%, a difference of 0.33%), and Immigrants from Portugal (2.6%, a difference of 0.55%).
| Demographics | Rating | Rank | Single Father Households |
| Belizeans | 0.2 /100 | #272 | Tragic 2.6% |
| Iroquois | 0.2 /100 | #273 | Tragic 2.6% |
| Puerto Ricans | 0.2 /100 | #274 | Tragic 2.6% |
| Immigrants | Dominican Republic | 0.2 /100 | #275 | Tragic 2.6% |
| Immigrants | Haiti | 0.1 /100 | #276 | Tragic 2.6% |
| Shoshone | 0.1 /100 | #277 | Tragic 2.6% |
| Cherokee | 0.1 /100 | #278 | Tragic 2.6% |
| Samoans | 0.1 /100 | #279 | Tragic 2.6% |
| Immigrants | Portugal | 0.1 /100 | #280 | Tragic 2.6% |
| Nicaraguans | 0.1 /100 | #281 | Tragic 2.6% |
| Dutch West Indians | 0.1 /100 | #282 | Tragic 2.6% |
| Immigrants | Nicaragua | 0.1 /100 | #283 | Tragic 2.7% |
| Hawaiians | 0.1 /100 | #284 | Tragic 2.7% |
| Ottawa | 0.1 /100 | #285 | Tragic 2.7% |
| Immigrants | Cuba | 0.1 /100 | #286 | Tragic 2.7% |
Demographics Similar to Indians (Asian) by Single Father Households
In terms of single father households, the demographic groups most similar to Indians (Asian) are Immigrants from India (1.9%, a difference of 0.50%), Immigrants from Iran (1.9%, a difference of 0.72%), Iranian (1.9%, a difference of 0.84%), Thai (1.9%, a difference of 0.91%), and Immigrants from Eastern Asia (1.9%, a difference of 0.93%).
| Demographics | Rating | Rank | Single Father Households |
| Immigrants | Belarus | 100.0 /100 | #11 | Exceptional 1.9% |
| Immigrants | Greece | 100.0 /100 | #12 | Exceptional 1.9% |
| Immigrants | Singapore | 100.0 /100 | #13 | Exceptional 1.9% |
| Immigrants | Lithuania | 100.0 /100 | #14 | Exceptional 1.9% |
| Immigrants | Eastern Asia | 100.0 /100 | #15 | Exceptional 1.9% |
| Immigrants | Iran | 100.0 /100 | #16 | Exceptional 1.9% |
| Immigrants | India | 100.0 /100 | #17 | Exceptional 1.9% |
| Indians (Asian) | 100.0 /100 | #18 | Exceptional 1.9% |
| Iranians | 100.0 /100 | #19 | Exceptional 1.9% |
| Thais | 100.0 /100 | #20 | Exceptional 1.9% |
| Immigrants | Albania | 100.0 /100 | #21 | Exceptional 1.9% |
| Immigrants | Latvia | 100.0 /100 | #22 | Exceptional 1.9% |
| Immigrants | Croatia | 100.0 /100 | #23 | Exceptional 2.0% |
| Immigrants | Russia | 100.0 /100 | #24 | Exceptional 2.0% |
| Eastern Europeans | 100.0 /100 | #25 | Exceptional 2.0% |