U.S. Virgin Islander vs Immigrants from Argentina Divorced or Separated
COMPARE
U.S. Virgin Islander
Immigrants from Argentina
Divorced or Separated
Divorced or Separated Comparison
U.S. Virgin Islanders
Immigrants from Argentina
13.4%
DIVORCED OR SEPARATED
0.0/ 100
METRIC RATING
323rd/ 347
METRIC RANK
12.2%
DIVORCED OR SEPARATED
15.5/ 100
METRIC RATING
214th/ 347
METRIC RANK
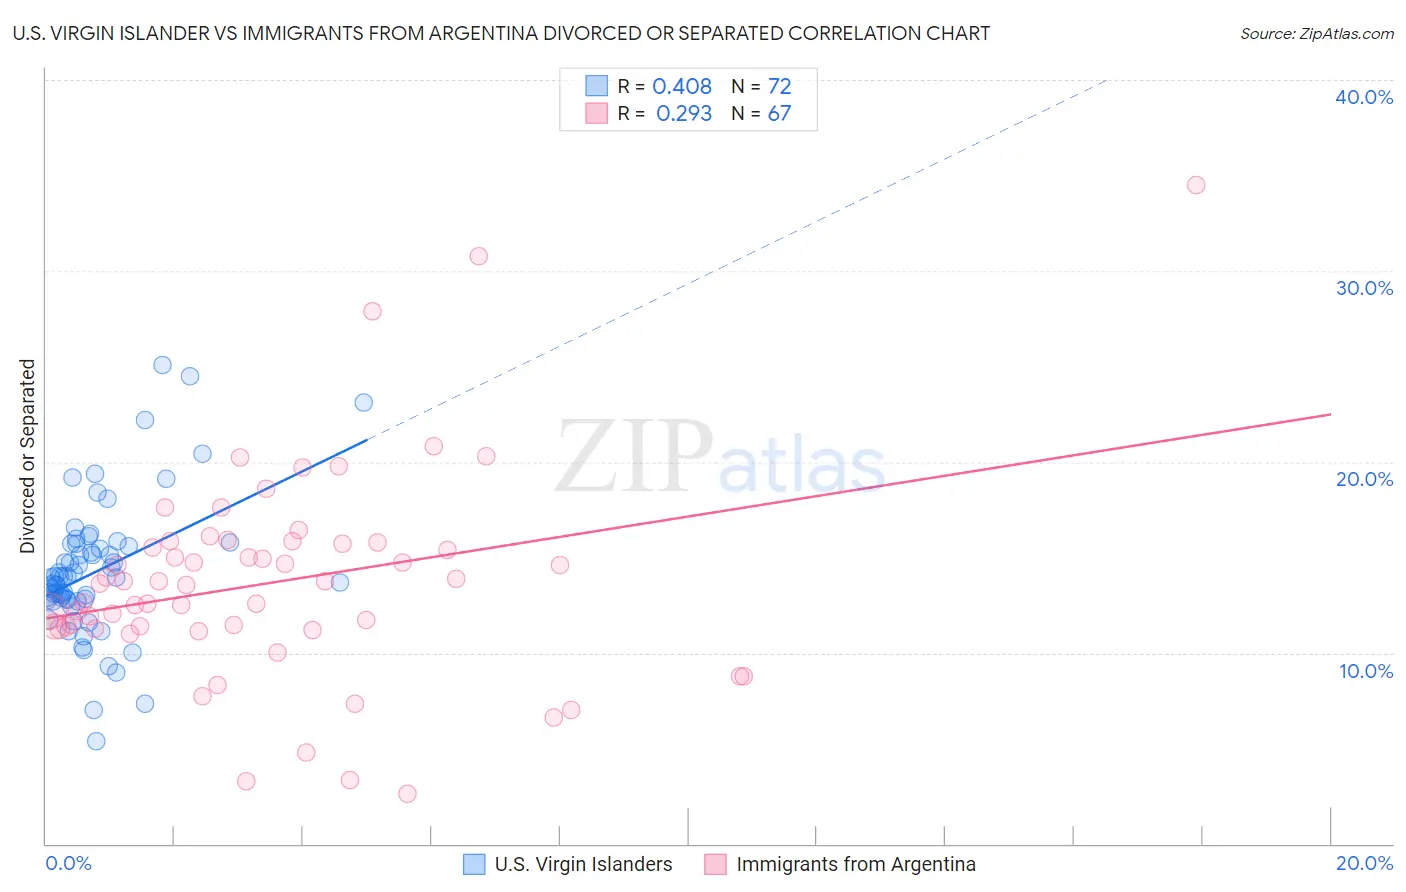
U.S. Virgin Islander vs Immigrants from Argentina Divorced or Separated Correlation Chart
The statistical analysis conducted on geographies consisting of 87,523,386 people shows a moderate positive correlation between the proportion of U.S. Virgin Islanders and percentage of population currently divorced or separated in the United States with a correlation coefficient (R) of 0.408 and weighted average of 13.4%. Similarly, the statistical analysis conducted on geographies consisting of 264,380,212 people shows a weak positive correlation between the proportion of Immigrants from Argentina and percentage of population currently divorced or separated in the United States with a correlation coefficient (R) of 0.293 and weighted average of 12.2%, a difference of 9.9%.
Divorced or Separated Correlation Summary
| Measurement | U.S. Virgin Islander | Immigrants from Argentina |
| Minimum | 5.4% | 2.6% |
| Maximum | 25.1% | 34.5% |
| Range | 19.7% | 31.9% |
| Mean | 14.2% | 13.7% |
| Median | 14.0% | 13.6% |
| Interquartile 25% (IQ1) | 12.8% | 11.3% |
| Interquartile 75% (IQ3) | 15.7% | 15.8% |
| Interquartile Range (IQR) | 2.9% | 4.5% |
| Standard Deviation (Sample) | 3.6% | 5.5% |
| Standard Deviation (Population) | 3.5% | 5.5% |
Similar Demographics by Divorced or Separated
Demographics Similar to U.S. Virgin Islanders by Divorced or Separated
In terms of divorced or separated, the demographic groups most similar to U.S. Virgin Islanders are Osage (13.4%, a difference of 0.070%), Potawatomi (13.5%, a difference of 0.13%), Immigrants from Congo (13.5%, a difference of 0.14%), Immigrants from Haiti (13.4%, a difference of 0.22%), and Cheyenne (13.4%, a difference of 0.46%).
| Demographics | Rating | Rank | Divorced or Separated |
| Tsimshian | 0.0 /100 | #316 | Tragic 13.3% |
| Haitians | 0.0 /100 | #317 | Tragic 13.3% |
| Cree | 0.0 /100 | #318 | Tragic 13.4% |
| Puget Sound Salish | 0.0 /100 | #319 | Tragic 13.4% |
| Cajuns | 0.0 /100 | #320 | Tragic 13.4% |
| Cheyenne | 0.0 /100 | #321 | Tragic 13.4% |
| Immigrants | Haiti | 0.0 /100 | #322 | Tragic 13.4% |
| U.S. Virgin Islanders | 0.0 /100 | #323 | Tragic 13.4% |
| Osage | 0.0 /100 | #324 | Tragic 13.4% |
| Potawatomi | 0.0 /100 | #325 | Tragic 13.5% |
| Immigrants | Congo | 0.0 /100 | #326 | Tragic 13.5% |
| Comanche | 0.0 /100 | #327 | Tragic 13.5% |
| Immigrants | Caribbean | 0.0 /100 | #328 | Tragic 13.6% |
| Houma | 0.0 /100 | #329 | Tragic 13.6% |
| Paiute | 0.0 /100 | #330 | Tragic 13.6% |
Demographics Similar to Immigrants from Argentina by Divorced or Separated
In terms of divorced or separated, the demographic groups most similar to Immigrants from Argentina are European (12.2%, a difference of 0.010%), Immigrants from South America (12.2%, a difference of 0.010%), Immigrants from Eastern Africa (12.2%, a difference of 0.050%), Northern European (12.2%, a difference of 0.050%), and Immigrants from Kenya (12.2%, a difference of 0.060%).
| Demographics | Rating | Rank | Divorced or Separated |
| Mexicans | 21.0 /100 | #207 | Fair 12.2% |
| Immigrants | Ghana | 18.8 /100 | #208 | Poor 12.2% |
| Immigrants | Trinidad and Tobago | 17.8 /100 | #209 | Poor 12.2% |
| Slavs | 17.0 /100 | #210 | Poor 12.2% |
| Trinidadians and Tobagonians | 16.6 /100 | #211 | Poor 12.2% |
| Immigrants | Kenya | 16.5 /100 | #212 | Poor 12.2% |
| Immigrants | Eastern Africa | 16.2 /100 | #213 | Poor 12.2% |
| Immigrants | Argentina | 15.5 /100 | #214 | Poor 12.2% |
| Europeans | 15.4 /100 | #215 | Poor 12.2% |
| Immigrants | South America | 15.4 /100 | #216 | Poor 12.2% |
| Northern Europeans | 14.7 /100 | #217 | Poor 12.2% |
| Slovenes | 13.2 /100 | #218 | Poor 12.3% |
| Czechoslovakians | 11.7 /100 | #219 | Poor 12.3% |
| British | 11.6 /100 | #220 | Poor 12.3% |
| Guamanians/Chamorros | 11.3 /100 | #221 | Poor 12.3% |