Puget Sound Salish vs Black/African American Average Family Size
COMPARE
Puget Sound Salish
Black/African American
Average Family Size
Average Family Size Comparison
Puget Sound Salish
Blacks/African Americans
3.17
AVERAGE FAMILY SIZE
1.9/ 100
METRIC RATING
250th/ 347
METRIC RANK
3.27
AVERAGE FAMILY SIZE
95.7/ 100
METRIC RATING
112th/ 347
METRIC RANK
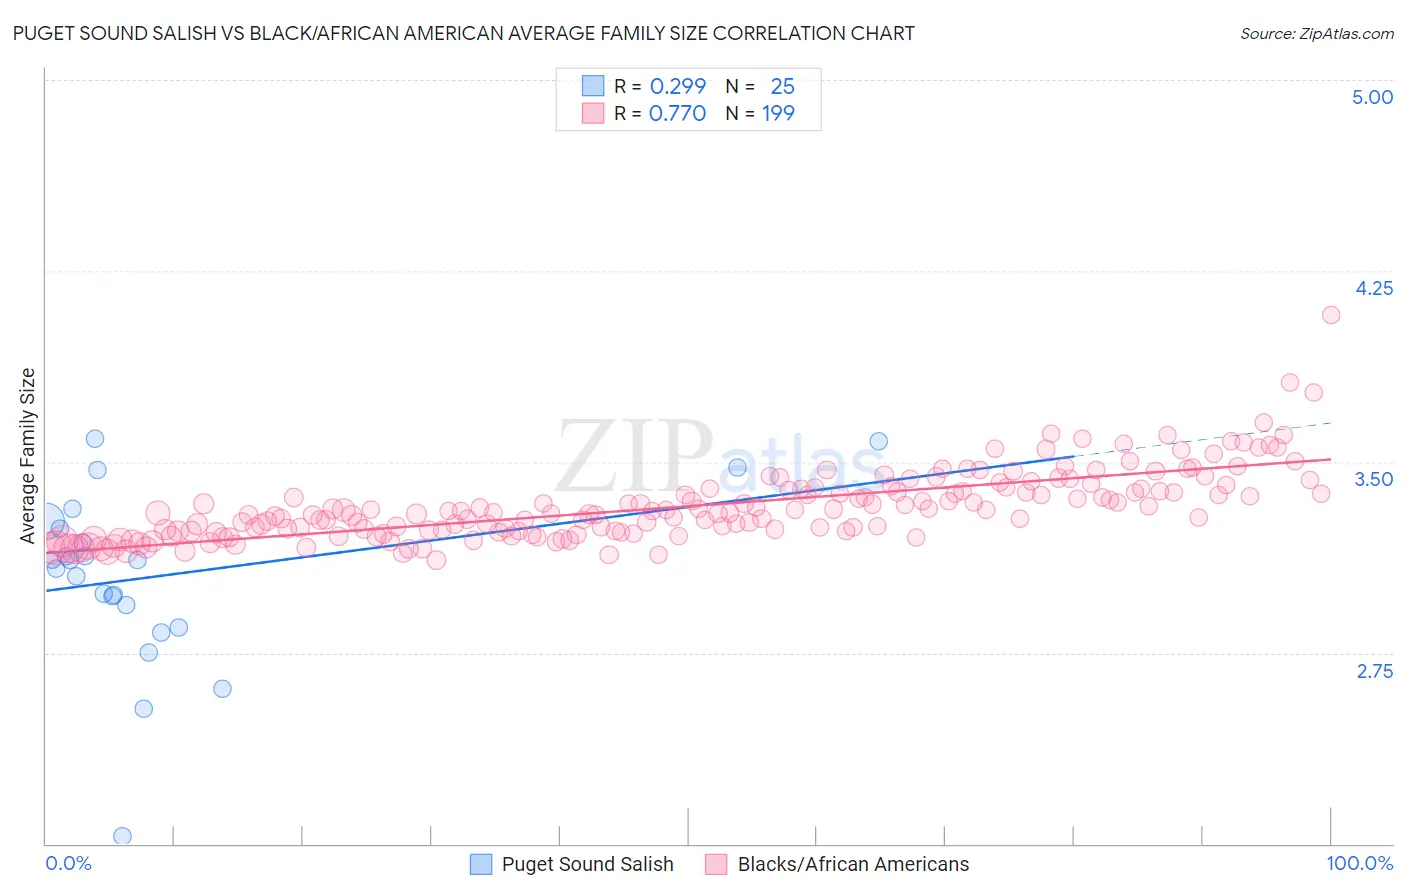
Puget Sound Salish vs Black/African American Average Family Size Correlation Chart
The statistical analysis conducted on geographies consisting of 46,155,775 people shows a weak positive correlation between the proportion of Puget Sound Salish and average family size in the United States with a correlation coefficient (R) of 0.299 and weighted average of 3.17. Similarly, the statistical analysis conducted on geographies consisting of 565,344,221 people shows a strong positive correlation between the proportion of Blacks/African Americans and average family size in the United States with a correlation coefficient (R) of 0.770 and weighted average of 3.27, a difference of 3.3%.
Average Family Size Correlation Summary
| Measurement | Puget Sound Salish | Black/African American |
| Minimum | 2.03 | 3.12 |
| Maximum | 3.59 | 4.08 |
| Range | 1.56 | 0.96 |
| Mean | 3.05 | 3.33 |
| Median | 3.11 | 3.30 |
| Interquartile 25% (IQ1) | 2.90 | 3.23 |
| Interquartile 75% (IQ3) | 3.25 | 3.39 |
| Interquartile Range (IQR) | 0.36 | 0.16 |
| Standard Deviation (Sample) | 0.34 | 0.14 |
| Standard Deviation (Population) | 0.34 | 0.14 |
Similar Demographics by Average Family Size
Demographics Similar to Puget Sound Salish by Average Family Size
In terms of average family size, the demographic groups most similar to Puget Sound Salish are Immigrants from Spain (3.17, a difference of 0.010%), Immigrants from Saudi Arabia (3.17, a difference of 0.040%), South African (3.17, a difference of 0.040%), Immigrants from Hungary (3.17, a difference of 0.050%), and Immigrants from Eastern Europe (3.17, a difference of 0.060%).
| Demographics | Rating | Rank | Average Family Size |
| Immigrants | Moldova | 2.9 /100 | #243 | Tragic 3.18 |
| Immigrants | Southern Europe | 2.9 /100 | #244 | Tragic 3.18 |
| Immigrants | Brazil | 2.7 /100 | #245 | Tragic 3.18 |
| Danes | 2.5 /100 | #246 | Tragic 3.17 |
| Cajuns | 2.4 /100 | #247 | Tragic 3.17 |
| Immigrants | Belarus | 2.3 /100 | #248 | Tragic 3.17 |
| Immigrants | Eastern Europe | 2.1 /100 | #249 | Tragic 3.17 |
| Puget Sound Salish | 1.9 /100 | #250 | Tragic 3.17 |
| Immigrants | Spain | 1.8 /100 | #251 | Tragic 3.17 |
| Immigrants | Saudi Arabia | 1.7 /100 | #252 | Tragic 3.17 |
| South Africans | 1.7 /100 | #253 | Tragic 3.17 |
| Immigrants | Hungary | 1.7 /100 | #254 | Tragic 3.17 |
| Cape Verdeans | 1.6 /100 | #255 | Tragic 3.17 |
| Immigrants | Kazakhstan | 1.5 /100 | #256 | Tragic 3.17 |
| Albanians | 1.5 /100 | #257 | Tragic 3.17 |
Demographics Similar to Blacks/African Americans by Average Family Size
In terms of average family size, the demographic groups most similar to Blacks/African Americans are Immigrants from Panama (3.27, a difference of 0.010%), Indonesian (3.28, a difference of 0.060%), South American (3.27, a difference of 0.060%), Immigrants from Liberia (3.27, a difference of 0.070%), and Immigrants from South America (3.27, a difference of 0.070%).
| Demographics | Rating | Rank | Average Family Size |
| Immigrants | Ghana | 98.1 /100 | #105 | Exceptional 3.29 |
| Paiute | 98.0 /100 | #106 | Exceptional 3.29 |
| Ghanaians | 98.0 /100 | #107 | Exceptional 3.29 |
| Asians | 97.0 /100 | #108 | Exceptional 3.28 |
| Puerto Ricans | 96.7 /100 | #109 | Exceptional 3.28 |
| Bahamians | 96.6 /100 | #110 | Exceptional 3.28 |
| Indonesians | 96.2 /100 | #111 | Exceptional 3.28 |
| Blacks/African Americans | 95.7 /100 | #112 | Exceptional 3.27 |
| Immigrants | Panama | 95.6 /100 | #113 | Exceptional 3.27 |
| South Americans | 95.1 /100 | #114 | Exceptional 3.27 |
| Immigrants | Liberia | 95.0 /100 | #115 | Exceptional 3.27 |
| Immigrants | South America | 95.0 /100 | #116 | Exceptional 3.27 |
| Kiowa | 94.8 /100 | #117 | Exceptional 3.27 |
| Immigrants | Asia | 94.0 /100 | #118 | Exceptional 3.27 |
| Immigrants | Indonesia | 93.7 /100 | #119 | Exceptional 3.27 |