Puget Sound Salish vs Delaware Average Family Size
COMPARE
Puget Sound Salish
Delaware
Average Family Size
Average Family Size Comparison
Puget Sound Salish
Delaware
3.17
AVERAGE FAMILY SIZE
1.9/ 100
METRIC RATING
250th/ 347
METRIC RANK
3.20
AVERAGE FAMILY SIZE
11.1/ 100
METRIC RATING
215th/ 347
METRIC RANK
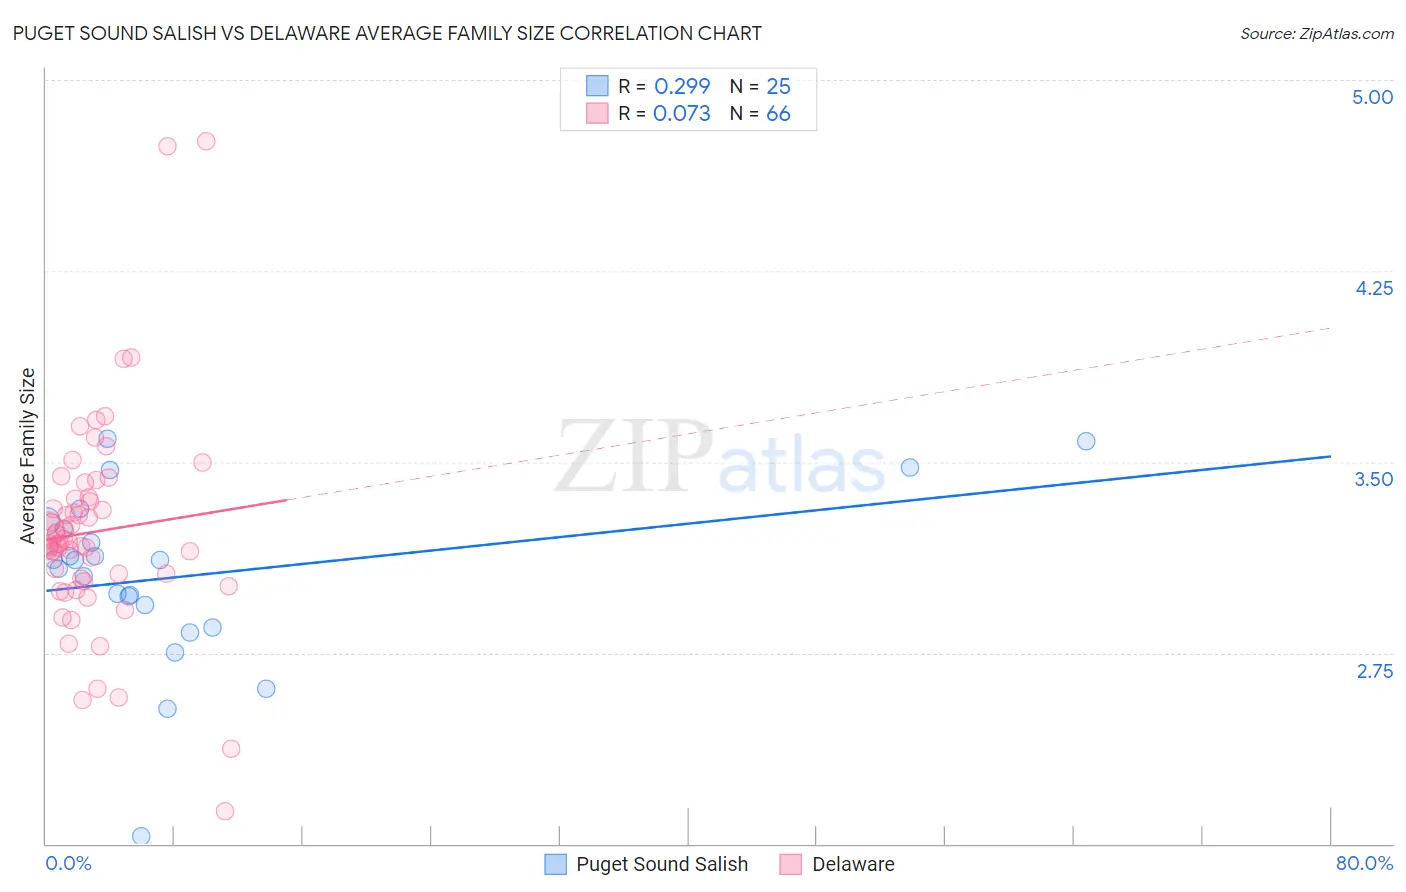
Puget Sound Salish vs Delaware Average Family Size Correlation Chart
The statistical analysis conducted on geographies consisting of 46,155,775 people shows a weak positive correlation between the proportion of Puget Sound Salish and average family size in the United States with a correlation coefficient (R) of 0.299 and weighted average of 3.17. Similarly, the statistical analysis conducted on geographies consisting of 96,226,564 people shows a slight positive correlation between the proportion of Delaware and average family size in the United States with a correlation coefficient (R) of 0.073 and weighted average of 3.20, a difference of 0.87%.
Average Family Size Correlation Summary
| Measurement | Puget Sound Salish | Delaware |
| Minimum | 2.03 | 2.13 |
| Maximum | 3.59 | 4.76 |
| Range | 1.56 | 2.63 |
| Mean | 3.05 | 3.22 |
| Median | 3.11 | 3.18 |
| Interquartile 25% (IQ1) | 2.90 | 3.04 |
| Interquartile 75% (IQ3) | 3.25 | 3.35 |
| Interquartile Range (IQR) | 0.36 | 0.31 |
| Standard Deviation (Sample) | 0.34 | 0.41 |
| Standard Deviation (Population) | 0.34 | 0.41 |
Similar Demographics by Average Family Size
Demographics Similar to Puget Sound Salish by Average Family Size
In terms of average family size, the demographic groups most similar to Puget Sound Salish are Immigrants from Spain (3.17, a difference of 0.010%), Immigrants from Saudi Arabia (3.17, a difference of 0.040%), South African (3.17, a difference of 0.040%), Immigrants from Hungary (3.17, a difference of 0.050%), and Immigrants from Eastern Europe (3.17, a difference of 0.060%).
| Demographics | Rating | Rank | Average Family Size |
| Immigrants | Moldova | 2.9 /100 | #243 | Tragic 3.18 |
| Immigrants | Southern Europe | 2.9 /100 | #244 | Tragic 3.18 |
| Immigrants | Brazil | 2.7 /100 | #245 | Tragic 3.18 |
| Danes | 2.5 /100 | #246 | Tragic 3.17 |
| Cajuns | 2.4 /100 | #247 | Tragic 3.17 |
| Immigrants | Belarus | 2.3 /100 | #248 | Tragic 3.17 |
| Immigrants | Eastern Europe | 2.1 /100 | #249 | Tragic 3.17 |
| Puget Sound Salish | 1.9 /100 | #250 | Tragic 3.17 |
| Immigrants | Spain | 1.8 /100 | #251 | Tragic 3.17 |
| Immigrants | Saudi Arabia | 1.7 /100 | #252 | Tragic 3.17 |
| South Africans | 1.7 /100 | #253 | Tragic 3.17 |
| Immigrants | Hungary | 1.7 /100 | #254 | Tragic 3.17 |
| Cape Verdeans | 1.6 /100 | #255 | Tragic 3.17 |
| Immigrants | Kazakhstan | 1.5 /100 | #256 | Tragic 3.17 |
| Albanians | 1.5 /100 | #257 | Tragic 3.17 |
Demographics Similar to Delaware by Average Family Size
In terms of average family size, the demographic groups most similar to Delaware are Bermudan (3.20, a difference of 0.0%), Somali (3.20, a difference of 0.010%), Mongolian (3.20, a difference of 0.020%), Immigrants from Somalia (3.20, a difference of 0.040%), and Immigrants from Iran (3.20, a difference of 0.050%).
| Demographics | Rating | Rank | Average Family Size |
| Chippewa | 13.3 /100 | #208 | Poor 3.20 |
| Sudanese | 13.3 /100 | #209 | Poor 3.20 |
| Zimbabweans | 12.6 /100 | #210 | Poor 3.20 |
| Immigrants | Iran | 12.1 /100 | #211 | Poor 3.20 |
| Creek | 12.1 /100 | #212 | Poor 3.20 |
| Mongolians | 11.5 /100 | #213 | Poor 3.20 |
| Somalis | 11.2 /100 | #214 | Poor 3.20 |
| Delaware | 11.1 /100 | #215 | Poor 3.20 |
| Bermudans | 11.0 /100 | #216 | Poor 3.20 |
| Immigrants | Somalia | 10.3 /100 | #217 | Poor 3.20 |
| French American Indians | 9.8 /100 | #218 | Tragic 3.20 |
| Pennsylvania Germans | 9.3 /100 | #219 | Tragic 3.19 |
| Lebanese | 9.1 /100 | #220 | Tragic 3.19 |
| Immigrants | Ukraine | 7.2 /100 | #221 | Tragic 3.19 |
| Immigrants | Kuwait | 7.2 /100 | #222 | Tragic 3.19 |