Polish vs Egyptian Currently Married
COMPARE
Polish
Egyptian
Currently Married
Currently Married Comparison
Poles
Egyptians
48.9%
CURRENTLY MARRIED
99.5/ 100
METRIC RATING
31st/ 347
METRIC RANK
47.9%
CURRENTLY MARRIED
94.8/ 100
METRIC RATING
96th/ 347
METRIC RANK
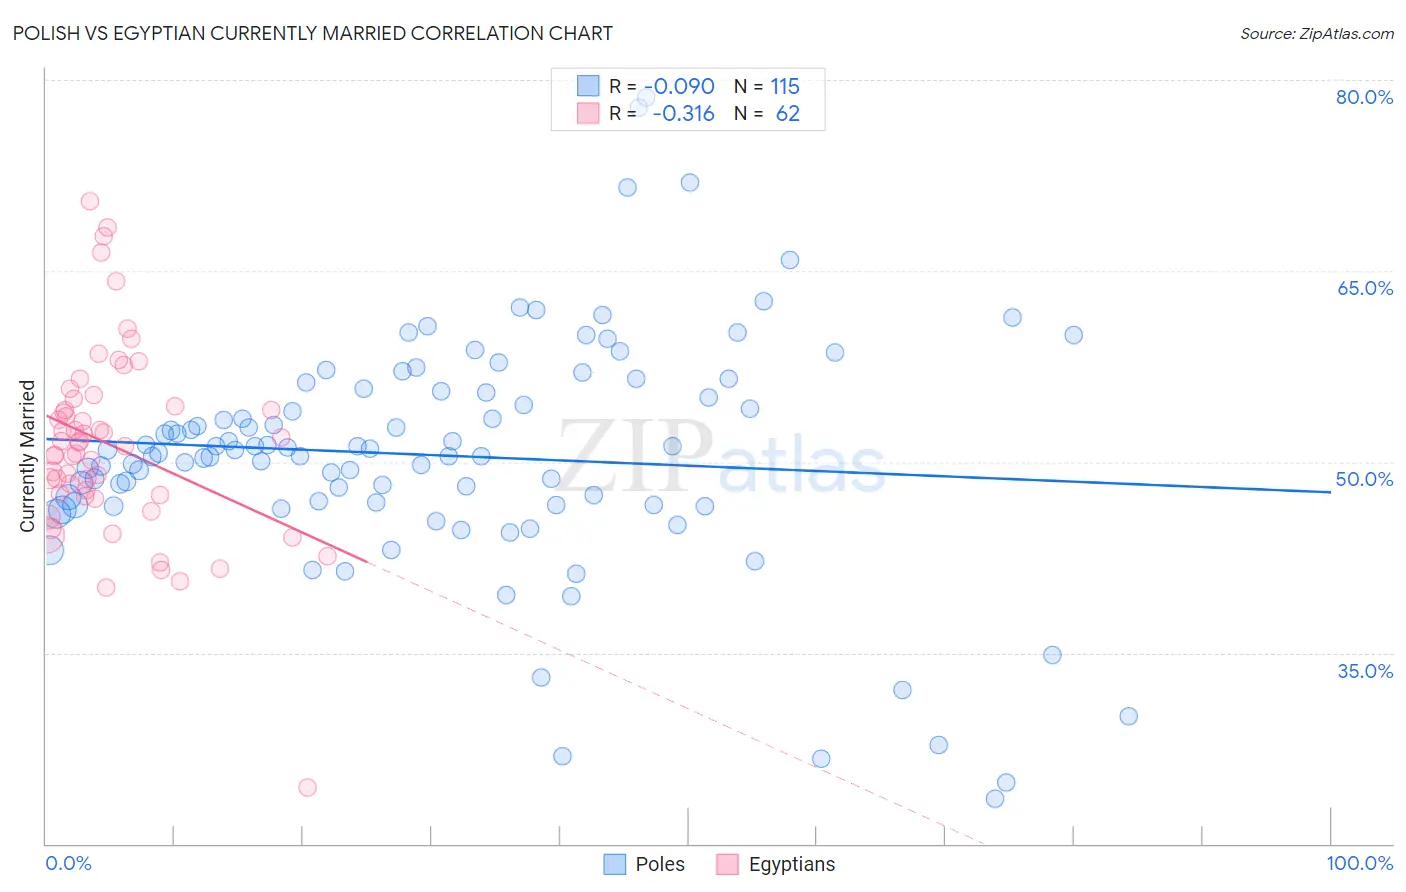
Polish vs Egyptian Currently Married Correlation Chart
The statistical analysis conducted on geographies consisting of 560,467,827 people shows a slight negative correlation between the proportion of Poles and percentage of population currently married in the United States with a correlation coefficient (R) of -0.090 and weighted average of 48.9%. Similarly, the statistical analysis conducted on geographies consisting of 276,890,367 people shows a mild negative correlation between the proportion of Egyptians and percentage of population currently married in the United States with a correlation coefficient (R) of -0.316 and weighted average of 47.9%, a difference of 2.1%.
Currently Married Correlation Summary
| Measurement | Polish | Egyptian |
| Minimum | 23.5% | 24.4% |
| Maximum | 78.6% | 70.4% |
| Range | 55.1% | 46.0% |
| Mean | 50.5% | 51.3% |
| Median | 50.7% | 51.4% |
| Interquartile 25% (IQ1) | 46.6% | 47.4% |
| Interquartile 75% (IQ3) | 55.6% | 54.4% |
| Interquartile Range (IQR) | 9.0% | 7.0% |
| Standard Deviation (Sample) | 9.4% | 7.5% |
| Standard Deviation (Population) | 9.3% | 7.5% |
Similar Demographics by Currently Married
Demographics Similar to Poles by Currently Married
In terms of currently married, the demographic groups most similar to Poles are Eastern European (48.9%, a difference of 0.0%), Croatian (48.9%, a difference of 0.010%), Immigrants from Hong Kong (48.9%, a difference of 0.010%), Irish (48.9%, a difference of 0.050%), and Welsh (48.9%, a difference of 0.060%).
| Demographics | Rating | Rank | Currently Married |
| Lithuanians | 99.6 /100 | #24 | Exceptional 49.0% |
| Maltese | 99.6 /100 | #25 | Exceptional 49.0% |
| Immigrants | Korea | 99.6 /100 | #26 | Exceptional 49.0% |
| Burmese | 99.6 /100 | #27 | Exceptional 48.9% |
| Welsh | 99.5 /100 | #28 | Exceptional 48.9% |
| Croatians | 99.5 /100 | #29 | Exceptional 48.9% |
| Eastern Europeans | 99.5 /100 | #30 | Exceptional 48.9% |
| Poles | 99.5 /100 | #31 | Exceptional 48.9% |
| Immigrants | Hong Kong | 99.5 /100 | #32 | Exceptional 48.9% |
| Irish | 99.5 /100 | #33 | Exceptional 48.9% |
| Immigrants | Lithuania | 99.4 /100 | #34 | Exceptional 48.8% |
| Immigrants | Northern Europe | 99.4 /100 | #35 | Exceptional 48.8% |
| Italians | 99.4 /100 | #36 | Exceptional 48.8% |
| Hungarians | 99.4 /100 | #37 | Exceptional 48.8% |
| Czechoslovakians | 99.4 /100 | #38 | Exceptional 48.8% |
Demographics Similar to Egyptians by Currently Married
In terms of currently married, the demographic groups most similar to Egyptians are Immigrants from Bulgaria (47.9%, a difference of 0.0%), Immigrants from Ukraine (47.9%, a difference of 0.010%), Immigrants from China (47.9%, a difference of 0.020%), Native Hawaiian (47.9%, a difference of 0.040%), and Lebanese (47.9%, a difference of 0.050%).
| Demographics | Rating | Rank | Currently Married |
| Indians (Asian) | 95.8 /100 | #89 | Exceptional 48.0% |
| Americans | 95.7 /100 | #90 | Exceptional 48.0% |
| Immigrants | Bolivia | 95.6 /100 | #91 | Exceptional 47.9% |
| Koreans | 95.4 /100 | #92 | Exceptional 47.9% |
| Lebanese | 95.1 /100 | #93 | Exceptional 47.9% |
| Native Hawaiians | 95.0 /100 | #94 | Exceptional 47.9% |
| Immigrants | Bulgaria | 94.8 /100 | #95 | Exceptional 47.9% |
| Egyptians | 94.8 /100 | #96 | Exceptional 47.9% |
| Immigrants | Ukraine | 94.8 /100 | #97 | Exceptional 47.9% |
| Immigrants | China | 94.7 /100 | #98 | Exceptional 47.9% |
| Immigrants | Sweden | 94.3 /100 | #99 | Exceptional 47.8% |
| Celtics | 94.2 /100 | #100 | Exceptional 47.8% |
| Immigrants | Germany | 94.1 /100 | #101 | Exceptional 47.8% |
| Turks | 93.9 /100 | #102 | Exceptional 47.8% |
| Cypriots | 93.7 /100 | #103 | Exceptional 47.8% |