Polish vs Immigrants from Senegal Currently Married
COMPARE
Polish
Immigrants from Senegal
Currently Married
Currently Married Comparison
Poles
Immigrants from Senegal
48.9%
CURRENTLY MARRIED
99.5/ 100
METRIC RATING
31st/ 347
METRIC RANK
40.7%
CURRENTLY MARRIED
0.0/ 100
METRIC RATING
324th/ 347
METRIC RANK
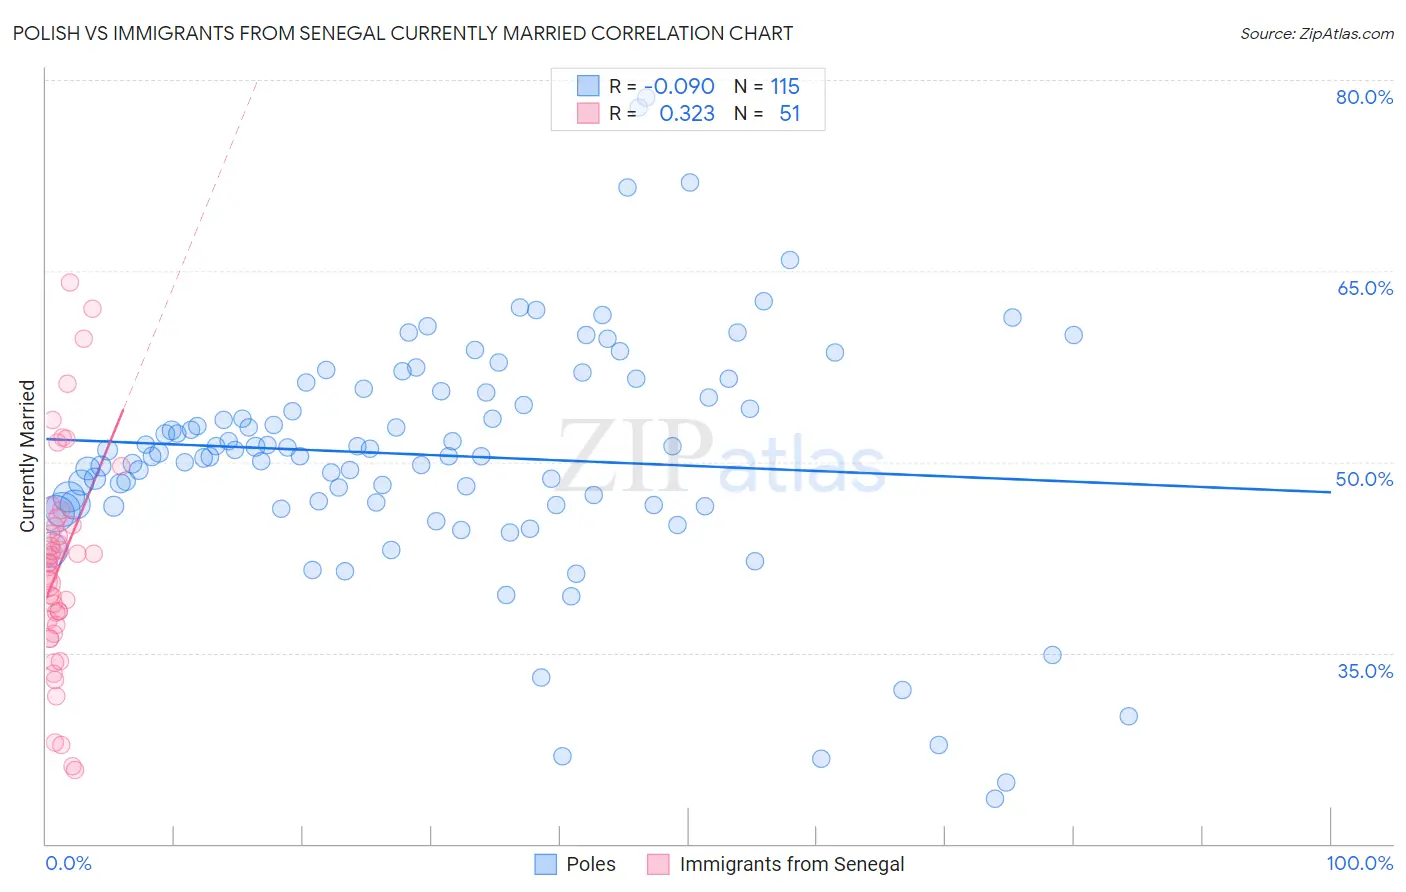
Polish vs Immigrants from Senegal Currently Married Correlation Chart
The statistical analysis conducted on geographies consisting of 560,467,827 people shows a slight negative correlation between the proportion of Poles and percentage of population currently married in the United States with a correlation coefficient (R) of -0.090 and weighted average of 48.9%. Similarly, the statistical analysis conducted on geographies consisting of 90,127,337 people shows a mild positive correlation between the proportion of Immigrants from Senegal and percentage of population currently married in the United States with a correlation coefficient (R) of 0.323 and weighted average of 40.7%, a difference of 20.1%.
Currently Married Correlation Summary
| Measurement | Polish | Immigrants from Senegal |
| Minimum | 23.5% | 25.8% |
| Maximum | 78.6% | 64.1% |
| Range | 55.1% | 38.3% |
| Mean | 50.5% | 41.9% |
| Median | 50.7% | 42.0% |
| Interquartile 25% (IQ1) | 46.6% | 37.2% |
| Interquartile 75% (IQ3) | 55.6% | 45.0% |
| Interquartile Range (IQR) | 9.0% | 7.8% |
| Standard Deviation (Sample) | 9.4% | 8.3% |
| Standard Deviation (Population) | 9.3% | 8.3% |
Similar Demographics by Currently Married
Demographics Similar to Poles by Currently Married
In terms of currently married, the demographic groups most similar to Poles are Eastern European (48.9%, a difference of 0.0%), Croatian (48.9%, a difference of 0.010%), Immigrants from Hong Kong (48.9%, a difference of 0.010%), Irish (48.9%, a difference of 0.050%), and Welsh (48.9%, a difference of 0.060%).
| Demographics | Rating | Rank | Currently Married |
| Lithuanians | 99.6 /100 | #24 | Exceptional 49.0% |
| Maltese | 99.6 /100 | #25 | Exceptional 49.0% |
| Immigrants | Korea | 99.6 /100 | #26 | Exceptional 49.0% |
| Burmese | 99.6 /100 | #27 | Exceptional 48.9% |
| Welsh | 99.5 /100 | #28 | Exceptional 48.9% |
| Croatians | 99.5 /100 | #29 | Exceptional 48.9% |
| Eastern Europeans | 99.5 /100 | #30 | Exceptional 48.9% |
| Poles | 99.5 /100 | #31 | Exceptional 48.9% |
| Immigrants | Hong Kong | 99.5 /100 | #32 | Exceptional 48.9% |
| Irish | 99.5 /100 | #33 | Exceptional 48.9% |
| Immigrants | Lithuania | 99.4 /100 | #34 | Exceptional 48.8% |
| Immigrants | Northern Europe | 99.4 /100 | #35 | Exceptional 48.8% |
| Italians | 99.4 /100 | #36 | Exceptional 48.8% |
| Hungarians | 99.4 /100 | #37 | Exceptional 48.8% |
| Czechoslovakians | 99.4 /100 | #38 | Exceptional 48.8% |
Demographics Similar to Immigrants from Senegal by Currently Married
In terms of currently married, the demographic groups most similar to Immigrants from Senegal are Immigrants from West Indies (40.7%, a difference of 0.010%), U.S. Virgin Islander (40.7%, a difference of 0.050%), Barbadian (40.6%, a difference of 0.19%), Senegalese (40.6%, a difference of 0.36%), and Arapaho (40.5%, a difference of 0.40%).
| Demographics | Rating | Rank | Currently Married |
| Haitians | 0.0 /100 | #317 | Tragic 41.3% |
| Bahamians | 0.0 /100 | #318 | Tragic 41.2% |
| Immigrants | Somalia | 0.0 /100 | #319 | Tragic 41.2% |
| Immigrants | Jamaica | 0.0 /100 | #320 | Tragic 41.1% |
| Immigrants | Congo | 0.0 /100 | #321 | Tragic 41.1% |
| Immigrants | Haiti | 0.0 /100 | #322 | Tragic 41.0% |
| Immigrants | West Indies | 0.0 /100 | #323 | Tragic 40.7% |
| Immigrants | Senegal | 0.0 /100 | #324 | Tragic 40.7% |
| U.S. Virgin Islanders | 0.0 /100 | #325 | Tragic 40.7% |
| Barbadians | 0.0 /100 | #326 | Tragic 40.6% |
| Senegalese | 0.0 /100 | #327 | Tragic 40.6% |
| Arapaho | 0.0 /100 | #328 | Tragic 40.5% |
| Crow | 0.0 /100 | #329 | Tragic 40.4% |
| Immigrants | Dominica | 0.0 /100 | #330 | Tragic 40.3% |
| Immigrants | Barbados | 0.0 /100 | #331 | Tragic 40.3% |