Pima vs Houma Divorced or Separated
COMPARE
Pima
Houma
Divorced or Separated
Divorced or Separated Comparison
Pima
Houma
12.9%
DIVORCED OR SEPARATED
0.0/ 100
METRIC RATING
290th/ 347
METRIC RANK
13.6%
DIVORCED OR SEPARATED
0.0/ 100
METRIC RATING
329th/ 347
METRIC RANK
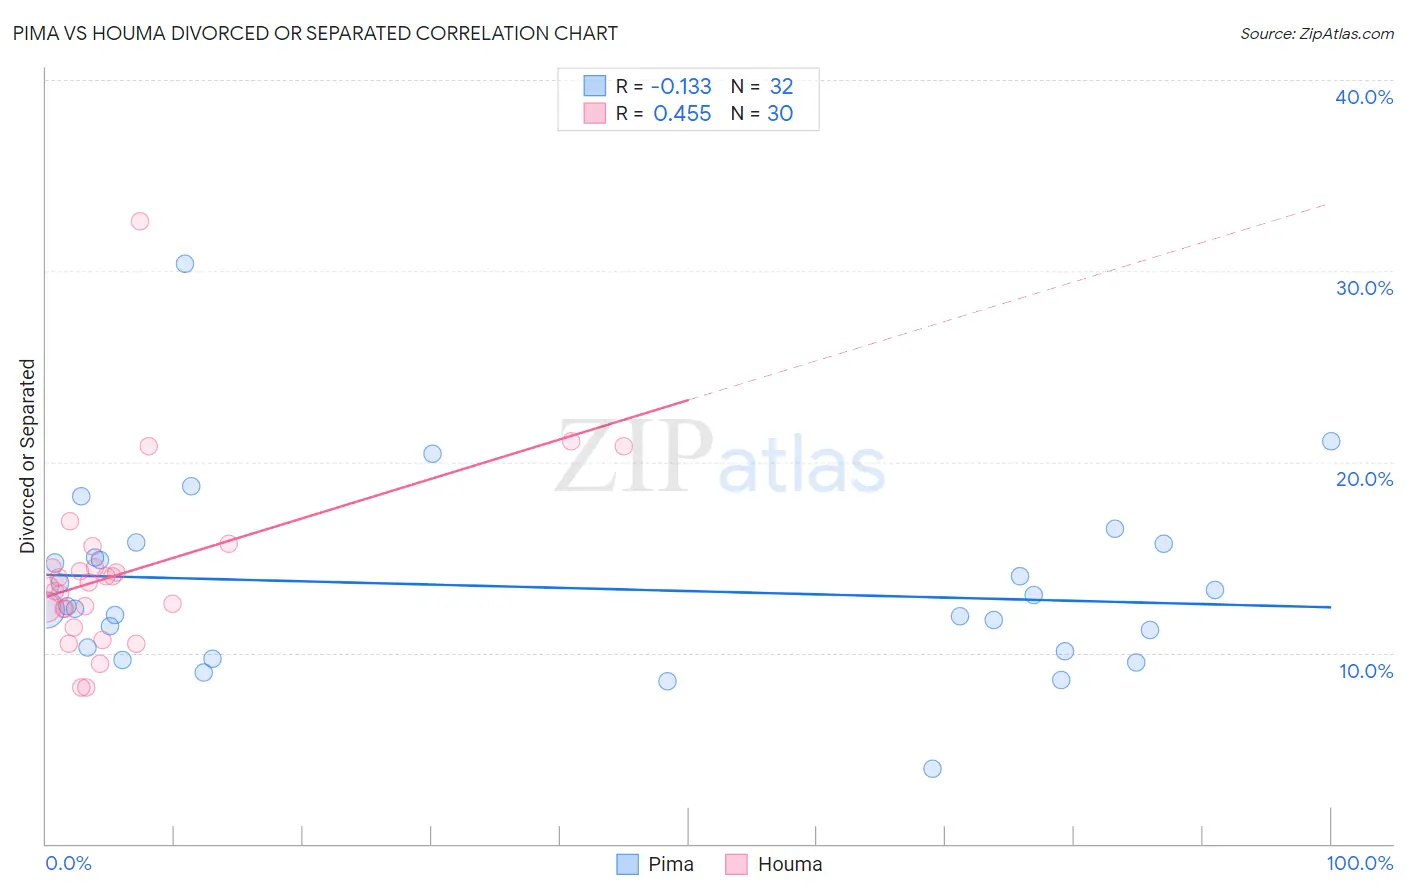
Pima vs Houma Divorced or Separated Correlation Chart
The statistical analysis conducted on geographies consisting of 61,551,758 people shows a poor negative correlation between the proportion of Pima and percentage of population currently divorced or separated in the United States with a correlation coefficient (R) of -0.133 and weighted average of 12.9%. Similarly, the statistical analysis conducted on geographies consisting of 36,793,405 people shows a moderate positive correlation between the proportion of Houma and percentage of population currently divorced or separated in the United States with a correlation coefficient (R) of 0.455 and weighted average of 13.6%, a difference of 5.6%.
Divorced or Separated Correlation Summary
| Measurement | Pima | Houma |
| Minimum | 3.9% | 8.2% |
| Maximum | 30.4% | 32.6% |
| Range | 26.5% | 24.4% |
| Mean | 13.4% | 14.2% |
| Median | 12.4% | 13.6% |
| Interquartile 25% (IQ1) | 10.2% | 12.3% |
| Interquartile 75% (IQ3) | 15.4% | 14.5% |
| Interquartile Range (IQR) | 5.2% | 2.2% |
| Standard Deviation (Sample) | 4.8% | 4.7% |
| Standard Deviation (Population) | 4.7% | 4.6% |
Similar Demographics by Divorced or Separated
Demographics Similar to Pima by Divorced or Separated
In terms of divorced or separated, the demographic groups most similar to Pima are Immigrants from Honduras (12.9%, a difference of 0.12%), Iroquois (12.9%, a difference of 0.14%), Scotch-Irish (12.9%, a difference of 0.17%), French Canadian (12.8%, a difference of 0.29%), and Jamaican (12.9%, a difference of 0.38%).
| Demographics | Rating | Rank | Divorced or Separated |
| Delaware | 0.1 /100 | #283 | Tragic 12.7% |
| Immigrants | Nonimmigrants | 0.1 /100 | #284 | Tragic 12.8% |
| French | 0.1 /100 | #285 | Tragic 12.8% |
| Spanish | 0.1 /100 | #286 | Tragic 12.8% |
| Hondurans | 0.1 /100 | #287 | Tragic 12.8% |
| French Canadians | 0.1 /100 | #288 | Tragic 12.8% |
| Iroquois | 0.0 /100 | #289 | Tragic 12.9% |
| Pima | 0.0 /100 | #290 | Tragic 12.9% |
| Immigrants | Honduras | 0.0 /100 | #291 | Tragic 12.9% |
| Scotch-Irish | 0.0 /100 | #292 | Tragic 12.9% |
| Jamaicans | 0.0 /100 | #293 | Tragic 12.9% |
| Apache | 0.0 /100 | #294 | Tragic 12.9% |
| Celtics | 0.0 /100 | #295 | Tragic 13.0% |
| Nicaraguans | 0.0 /100 | #296 | Tragic 13.0% |
| Natives/Alaskans | 0.0 /100 | #297 | Tragic 13.0% |
Demographics Similar to Houma by Divorced or Separated
In terms of divorced or separated, the demographic groups most similar to Houma are Paiute (13.6%, a difference of 0.11%), Immigrants from Caribbean (13.6%, a difference of 0.15%), Black/African American (13.6%, a difference of 0.24%), Comanche (13.5%, a difference of 0.53%), and Cherokee (13.7%, a difference of 1.0%).
| Demographics | Rating | Rank | Divorced or Separated |
| Immigrants | Haiti | 0.0 /100 | #322 | Tragic 13.4% |
| U.S. Virgin Islanders | 0.0 /100 | #323 | Tragic 13.4% |
| Osage | 0.0 /100 | #324 | Tragic 13.4% |
| Potawatomi | 0.0 /100 | #325 | Tragic 13.5% |
| Immigrants | Congo | 0.0 /100 | #326 | Tragic 13.5% |
| Comanche | 0.0 /100 | #327 | Tragic 13.5% |
| Immigrants | Caribbean | 0.0 /100 | #328 | Tragic 13.6% |
| Houma | 0.0 /100 | #329 | Tragic 13.6% |
| Paiute | 0.0 /100 | #330 | Tragic 13.6% |
| Blacks/African Americans | 0.0 /100 | #331 | Tragic 13.6% |
| Cherokee | 0.0 /100 | #332 | Tragic 13.7% |
| Puerto Ricans | 0.0 /100 | #333 | Tragic 13.9% |
| Immigrants | Bahamas | 0.0 /100 | #334 | Tragic 13.9% |
| Dutch West Indians | 0.0 /100 | #335 | Tragic 14.0% |
| Shoshone | 0.0 /100 | #336 | Tragic 14.0% |