Peruvian vs Immigrants from Uganda Divorced or Separated
COMPARE
Peruvian
Immigrants from Uganda
Divorced or Separated
Divorced or Separated Comparison
Peruvians
Immigrants from Uganda
11.9%
DIVORCED OR SEPARATED
80.9/ 100
METRIC RATING
144th/ 347
METRIC RANK
11.7%
DIVORCED OR SEPARATED
95.3/ 100
METRIC RATING
117th/ 347
METRIC RANK
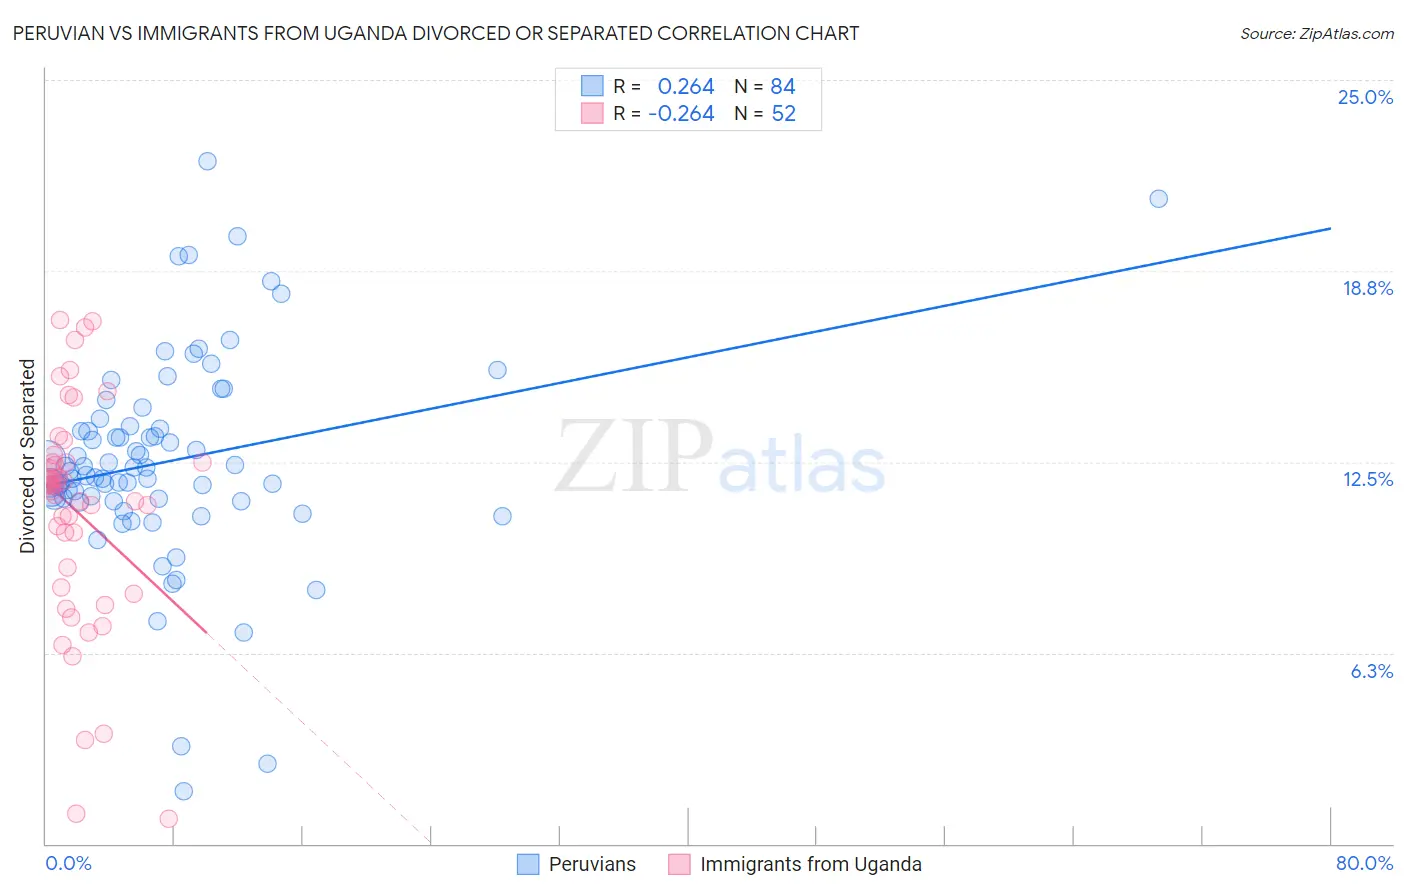
Peruvian vs Immigrants from Uganda Divorced or Separated Correlation Chart
The statistical analysis conducted on geographies consisting of 363,080,575 people shows a weak positive correlation between the proportion of Peruvians and percentage of population currently divorced or separated in the United States with a correlation coefficient (R) of 0.264 and weighted average of 11.9%. Similarly, the statistical analysis conducted on geographies consisting of 125,976,445 people shows a weak negative correlation between the proportion of Immigrants from Uganda and percentage of population currently divorced or separated in the United States with a correlation coefficient (R) of -0.264 and weighted average of 11.7%, a difference of 1.4%.
Divorced or Separated Correlation Summary
| Measurement | Peruvian | Immigrants from Uganda |
| Minimum | 1.7% | 0.80% |
| Maximum | 22.4% | 17.2% |
| Range | 20.7% | 16.4% |
| Mean | 12.5% | 10.9% |
| Median | 12.1% | 11.7% |
| Interquartile 25% (IQ1) | 11.3% | 8.7% |
| Interquartile 75% (IQ3) | 13.6% | 12.5% |
| Interquartile Range (IQR) | 2.4% | 3.8% |
| Standard Deviation (Sample) | 3.4% | 3.7% |
| Standard Deviation (Population) | 3.4% | 3.7% |
Similar Demographics by Divorced or Separated
Demographics Similar to Peruvians by Divorced or Separated
In terms of divorced or separated, the demographic groups most similar to Peruvians are Croatian (11.9%, a difference of 0.020%), Immigrants from Zimbabwe (11.9%, a difference of 0.030%), Pakistani (11.9%, a difference of 0.030%), Immigrants from Grenada (11.9%, a difference of 0.10%), and Immigrants from Morocco (11.9%, a difference of 0.12%).
| Demographics | Rating | Rank | Divorced or Separated |
| Alsatians | 84.0 /100 | #137 | Excellent 11.9% |
| Immigrants | Netherlands | 83.9 /100 | #138 | Excellent 11.9% |
| Australians | 83.6 /100 | #139 | Excellent 11.9% |
| Lebanese | 83.4 /100 | #140 | Excellent 11.9% |
| Immigrants | Morocco | 82.9 /100 | #141 | Excellent 11.9% |
| Immigrants | Zimbabwe | 81.5 /100 | #142 | Excellent 11.9% |
| Pakistanis | 81.3 /100 | #143 | Excellent 11.9% |
| Peruvians | 80.9 /100 | #144 | Excellent 11.9% |
| Croatians | 80.6 /100 | #145 | Excellent 11.9% |
| Immigrants | Grenada | 79.1 /100 | #146 | Good 11.9% |
| Poles | 78.6 /100 | #147 | Good 11.9% |
| Italians | 77.8 /100 | #148 | Good 11.9% |
| Immigrants | Oceania | 77.7 /100 | #149 | Good 11.9% |
| Immigrants | Portugal | 77.3 /100 | #150 | Good 11.9% |
| Czechs | 76.4 /100 | #151 | Good 11.9% |
Demographics Similar to Immigrants from Uganda by Divorced or Separated
In terms of divorced or separated, the demographic groups most similar to Immigrants from Uganda are Ecuadorian (11.7%, a difference of 0.0%), Immigrants from Iraq (11.7%, a difference of 0.020%), Syrian (11.7%, a difference of 0.050%), Lithuanian (11.7%, a difference of 0.080%), and Immigrants from Norway (11.7%, a difference of 0.13%).
| Demographics | Rating | Rank | Divorced or Separated |
| Immigrants | Czechoslovakia | 96.9 /100 | #110 | Exceptional 11.7% |
| Immigrants | Spain | 96.8 /100 | #111 | Exceptional 11.7% |
| Immigrants | France | 96.6 /100 | #112 | Exceptional 11.7% |
| Estonians | 96.6 /100 | #113 | Exceptional 11.7% |
| Immigrants | Norway | 95.9 /100 | #114 | Exceptional 11.7% |
| Lithuanians | 95.7 /100 | #115 | Exceptional 11.7% |
| Immigrants | Iraq | 95.4 /100 | #116 | Exceptional 11.7% |
| Immigrants | Uganda | 95.3 /100 | #117 | Exceptional 11.7% |
| Ecuadorians | 95.3 /100 | #118 | Exceptional 11.7% |
| Syrians | 95.1 /100 | #119 | Exceptional 11.7% |
| Iraqis | 94.6 /100 | #120 | Exceptional 11.8% |
| Romanians | 94.5 /100 | #121 | Exceptional 11.8% |
| Menominee | 93.8 /100 | #122 | Exceptional 11.8% |
| Immigrants | Immigrants | 93.7 /100 | #123 | Exceptional 11.8% |
| Ugandans | 93.1 /100 | #124 | Exceptional 11.8% |