Immigrants from Uruguay vs Liberian Single Father Households
COMPARE
Immigrants from Uruguay
Liberian
Single Father Households
Single Father Households Comparison
Immigrants from Uruguay
Liberians
2.4%
SINGLE FATHER HOUSEHOLDS
11.0/ 100
METRIC RATING
223rd/ 347
METRIC RANK
2.5%
SINGLE FATHER HOUSEHOLDS
2.0/ 100
METRIC RATING
251st/ 347
METRIC RANK
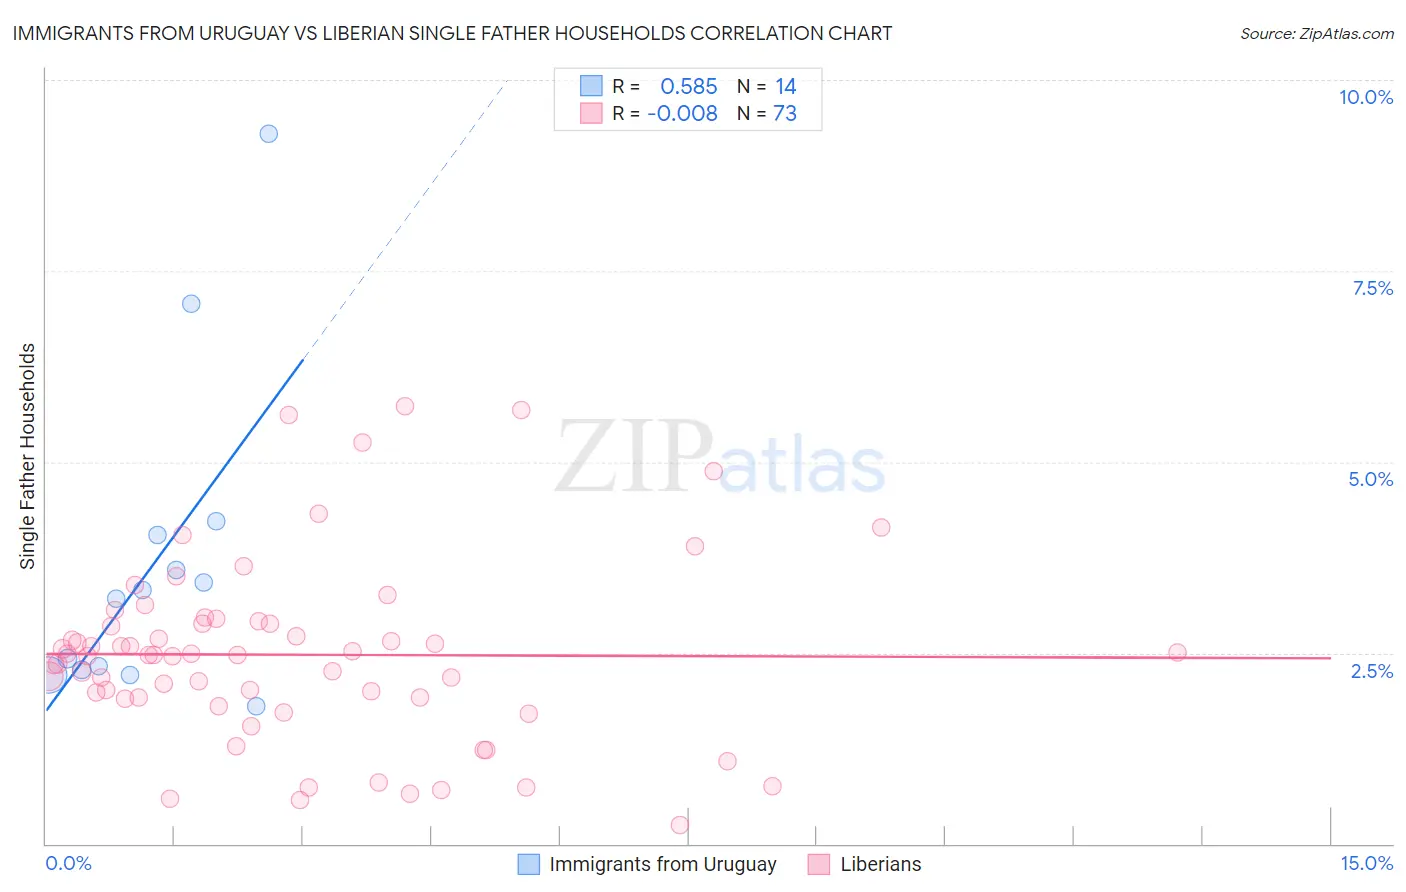
Immigrants from Uruguay vs Liberian Single Father Households Correlation Chart
The statistical analysis conducted on geographies consisting of 132,991,914 people shows a substantial positive correlation between the proportion of Immigrants from Uruguay and percentage of single father households in the United States with a correlation coefficient (R) of 0.585 and weighted average of 2.4%. Similarly, the statistical analysis conducted on geographies consisting of 117,831,420 people shows no correlation between the proportion of Liberians and percentage of single father households in the United States with a correlation coefficient (R) of -0.008 and weighted average of 2.5%, a difference of 3.2%.
Single Father Households Correlation Summary
| Measurement | Immigrants from Uruguay | Liberian |
| Minimum | 1.8% | 0.24% |
| Maximum | 9.3% | 5.7% |
| Range | 7.5% | 5.5% |
| Mean | 3.7% | 2.5% |
| Median | 3.3% | 2.5% |
| Interquartile 25% (IQ1) | 2.3% | 1.9% |
| Interquartile 75% (IQ3) | 4.0% | 2.9% |
| Interquartile Range (IQR) | 1.8% | 0.99% |
| Standard Deviation (Sample) | 2.1% | 1.2% |
| Standard Deviation (Population) | 2.0% | 1.2% |
Similar Demographics by Single Father Households
Demographics Similar to Immigrants from Uruguay by Single Father Households
In terms of single father households, the demographic groups most similar to Immigrants from Uruguay are Immigrants from Bahamas (2.4%, a difference of 0.070%), Immigrants from Eastern Africa (2.4%, a difference of 0.16%), Immigrants from Burma/Myanmar (2.4%, a difference of 0.19%), Marshallese (2.4%, a difference of 0.25%), and Black/African American (2.4%, a difference of 0.26%).
| Demographics | Rating | Rank | Single Father Households |
| Immigrants | Ecuador | 14.9 /100 | #216 | Poor 2.4% |
| Dutch | 14.3 /100 | #217 | Poor 2.4% |
| Immigrants | Ethiopia | 13.4 /100 | #218 | Poor 2.4% |
| Sudanese | 13.0 /100 | #219 | Poor 2.4% |
| Ghanaians | 12.9 /100 | #220 | Poor 2.4% |
| Immigrants | Burma/Myanmar | 12.1 /100 | #221 | Poor 2.4% |
| Immigrants | Eastern Africa | 11.9 /100 | #222 | Poor 2.4% |
| Immigrants | Uruguay | 11.0 /100 | #223 | Poor 2.4% |
| Immigrants | Bahamas | 10.6 /100 | #224 | Poor 2.4% |
| Marshallese | 9.7 /100 | #225 | Tragic 2.4% |
| Blacks/African Americans | 9.7 /100 | #226 | Tragic 2.4% |
| Americans | 9.3 /100 | #227 | Tragic 2.4% |
| Immigrants | Ghana | 9.1 /100 | #228 | Tragic 2.4% |
| Immigrants | Zaire | 8.6 /100 | #229 | Tragic 2.4% |
| Sub-Saharan Africans | 8.3 /100 | #230 | Tragic 2.4% |
Demographics Similar to Liberians by Single Father Households
In terms of single father households, the demographic groups most similar to Liberians are Immigrants from Eritrea (2.5%, a difference of 0.020%), Somali (2.5%, a difference of 0.090%), Immigrants from Somalia (2.5%, a difference of 0.090%), Immigrants from Thailand (2.5%, a difference of 0.13%), and Immigrants from Cameroon (2.5%, a difference of 0.26%).
| Demographics | Rating | Rank | Single Father Households |
| Immigrants | Middle Africa | 2.8 /100 | #244 | Tragic 2.5% |
| Basques | 2.5 /100 | #245 | Tragic 2.5% |
| Native Hawaiians | 2.5 /100 | #246 | Tragic 2.5% |
| Delaware | 2.5 /100 | #247 | Tragic 2.5% |
| Bahamians | 2.4 /100 | #248 | Tragic 2.5% |
| Immigrants | Cameroon | 2.3 /100 | #249 | Tragic 2.5% |
| Somalis | 2.1 /100 | #250 | Tragic 2.5% |
| Liberians | 2.0 /100 | #251 | Tragic 2.5% |
| Immigrants | Eritrea | 2.0 /100 | #252 | Tragic 2.5% |
| Immigrants | Somalia | 1.9 /100 | #253 | Tragic 2.5% |
| Immigrants | Thailand | 1.8 /100 | #254 | Tragic 2.5% |
| Tongans | 1.5 /100 | #255 | Tragic 2.5% |
| Potawatomi | 1.4 /100 | #256 | Tragic 2.5% |
| Immigrants | Congo | 1.2 /100 | #257 | Tragic 2.5% |
| Spanish | 1.1 /100 | #258 | Tragic 2.5% |