Immigrants from Chile vs Norwegian Currently Married
COMPARE
Immigrants from Chile
Norwegian
Currently Married
Currently Married Comparison
Immigrants from Chile
Norwegians
46.4%
CURRENTLY MARRIED
36.8/ 100
METRIC RATING
186th/ 347
METRIC RANK
50.2%
CURRENTLY MARRIED
100.0/ 100
METRIC RATING
6th/ 347
METRIC RANK
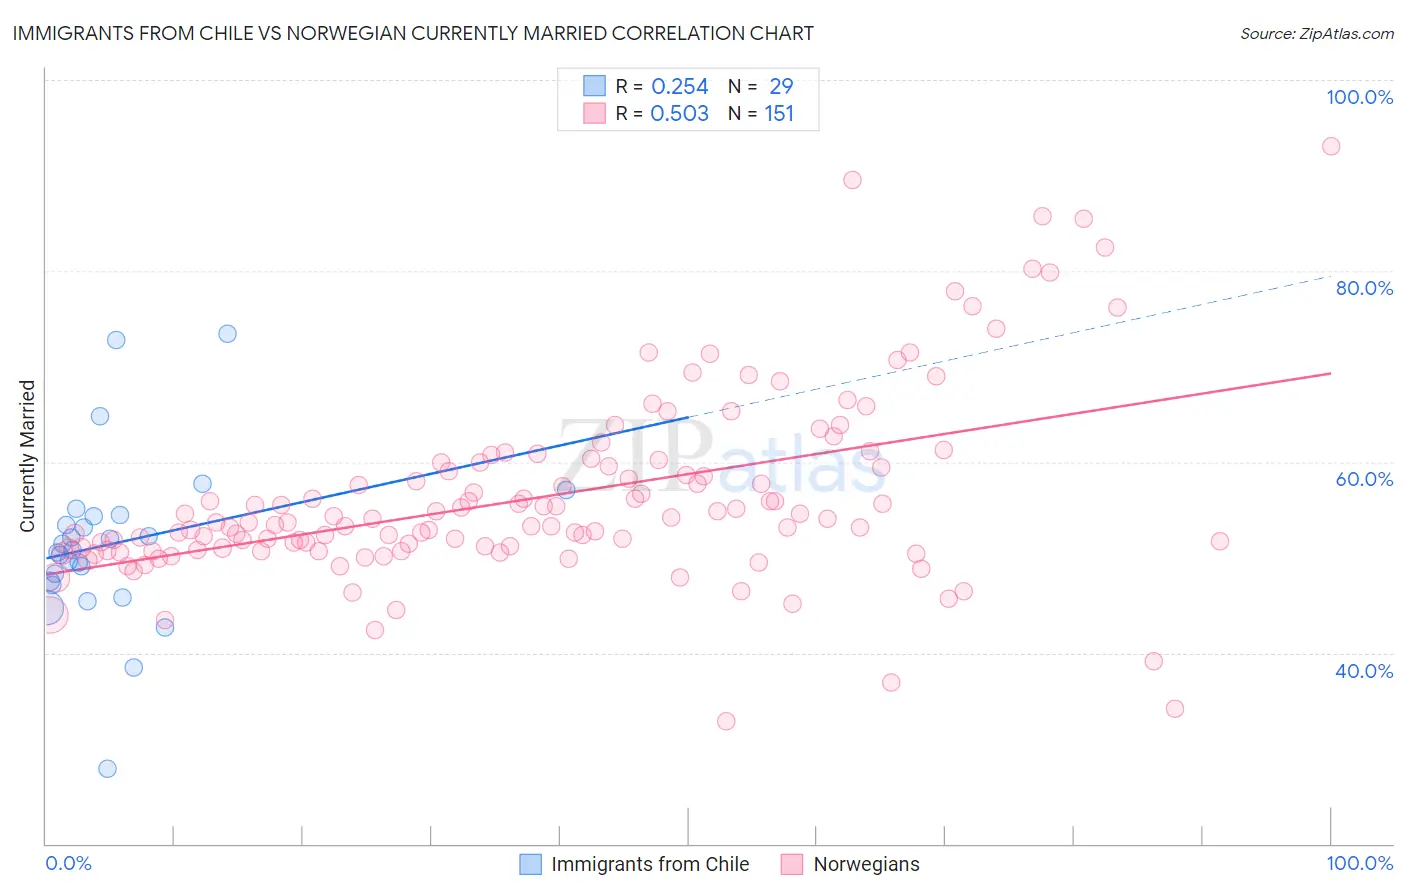
Immigrants from Chile vs Norwegian Currently Married Correlation Chart
The statistical analysis conducted on geographies consisting of 218,644,057 people shows a weak positive correlation between the proportion of Immigrants from Chile and percentage of population currently married in the United States with a correlation coefficient (R) of 0.254 and weighted average of 46.4%. Similarly, the statistical analysis conducted on geographies consisting of 533,299,404 people shows a substantial positive correlation between the proportion of Norwegians and percentage of population currently married in the United States with a correlation coefficient (R) of 0.503 and weighted average of 50.2%, a difference of 8.2%.
Currently Married Correlation Summary
| Measurement | Immigrants from Chile | Norwegian |
| Minimum | 27.8% | 32.9% |
| Maximum | 73.4% | 93.0% |
| Range | 45.6% | 60.2% |
| Mean | 51.4% | 56.4% |
| Median | 50.8% | 53.7% |
| Interquartile 25% (IQ1) | 47.3% | 50.8% |
| Interquartile 75% (IQ3) | 54.4% | 59.9% |
| Interquartile Range (IQR) | 7.0% | 9.1% |
| Standard Deviation (Sample) | 8.9% | 9.9% |
| Standard Deviation (Population) | 8.7% | 9.8% |
Similar Demographics by Currently Married
Demographics Similar to Immigrants from Chile by Currently Married
In terms of currently married, the demographic groups most similar to Immigrants from Chile are Mongolian (46.4%, a difference of 0.030%), Immigrants from Peru (46.4%, a difference of 0.060%), Brazilian (46.4%, a difference of 0.10%), Immigrants from Northern Africa (46.5%, a difference of 0.11%), and Potawatomi (46.5%, a difference of 0.20%).
| Demographics | Rating | Rank | Currently Married |
| Immigrants | Oceania | 44.6 /100 | #179 | Average 46.5% |
| Costa Ricans | 43.7 /100 | #180 | Average 46.5% |
| Ottawa | 43.0 /100 | #181 | Average 46.5% |
| Potawatomi | 41.9 /100 | #182 | Average 46.5% |
| Immigrants | Northern Africa | 39.7 /100 | #183 | Fair 46.5% |
| Brazilians | 39.3 /100 | #184 | Fair 46.4% |
| Mongolians | 37.6 /100 | #185 | Fair 46.4% |
| Immigrants | Chile | 36.8 /100 | #186 | Fair 46.4% |
| Immigrants | Peru | 35.3 /100 | #187 | Fair 46.4% |
| Colombians | 31.8 /100 | #188 | Fair 46.3% |
| Fijians | 30.3 /100 | #189 | Fair 46.3% |
| Choctaw | 29.1 /100 | #190 | Fair 46.3% |
| Immigrants | France | 27.7 /100 | #191 | Fair 46.2% |
| Soviet Union | 25.7 /100 | #192 | Fair 46.2% |
| Immigrants | Fiji | 25.0 /100 | #193 | Fair 46.2% |
Demographics Similar to Norwegians by Currently Married
In terms of currently married, the demographic groups most similar to Norwegians are Immigrants from South Central Asia (50.0%, a difference of 0.34%), Swedish (50.0%, a difference of 0.47%), Danish (50.5%, a difference of 0.54%), Czech (49.9%, a difference of 0.66%), and Filipino (49.7%, a difference of 0.92%).
| Demographics | Rating | Rank | Currently Married |
| Immigrants | India | 100.0 /100 | #1 | Exceptional 51.8% |
| Thais | 100.0 /100 | #2 | Exceptional 50.9% |
| Assyrians/Chaldeans/Syriacs | 100.0 /100 | #3 | Exceptional 50.8% |
| Immigrants | Taiwan | 100.0 /100 | #4 | Exceptional 50.7% |
| Danes | 100.0 /100 | #5 | Exceptional 50.5% |
| Norwegians | 100.0 /100 | #6 | Exceptional 50.2% |
| Immigrants | South Central Asia | 100.0 /100 | #7 | Exceptional 50.0% |
| Swedes | 100.0 /100 | #8 | Exceptional 50.0% |
| Czechs | 99.9 /100 | #9 | Exceptional 49.9% |
| Filipinos | 99.9 /100 | #10 | Exceptional 49.7% |
| English | 99.9 /100 | #11 | Exceptional 49.7% |
| Swiss | 99.9 /100 | #12 | Exceptional 49.7% |
| Dutch | 99.9 /100 | #13 | Exceptional 49.6% |
| Germans | 99.9 /100 | #14 | Exceptional 49.6% |
| Pennsylvania Germans | 99.9 /100 | #15 | Exceptional 49.6% |