Immigrants from Spain vs Immigrants from Chile Currently Married
COMPARE
Immigrants from Spain
Immigrants from Chile
Currently Married
Currently Married Comparison
Immigrants from Spain
Immigrants from Chile
45.8%
CURRENTLY MARRIED
11.6/ 100
METRIC RATING
204th/ 347
METRIC RANK
46.4%
CURRENTLY MARRIED
36.8/ 100
METRIC RATING
186th/ 347
METRIC RANK
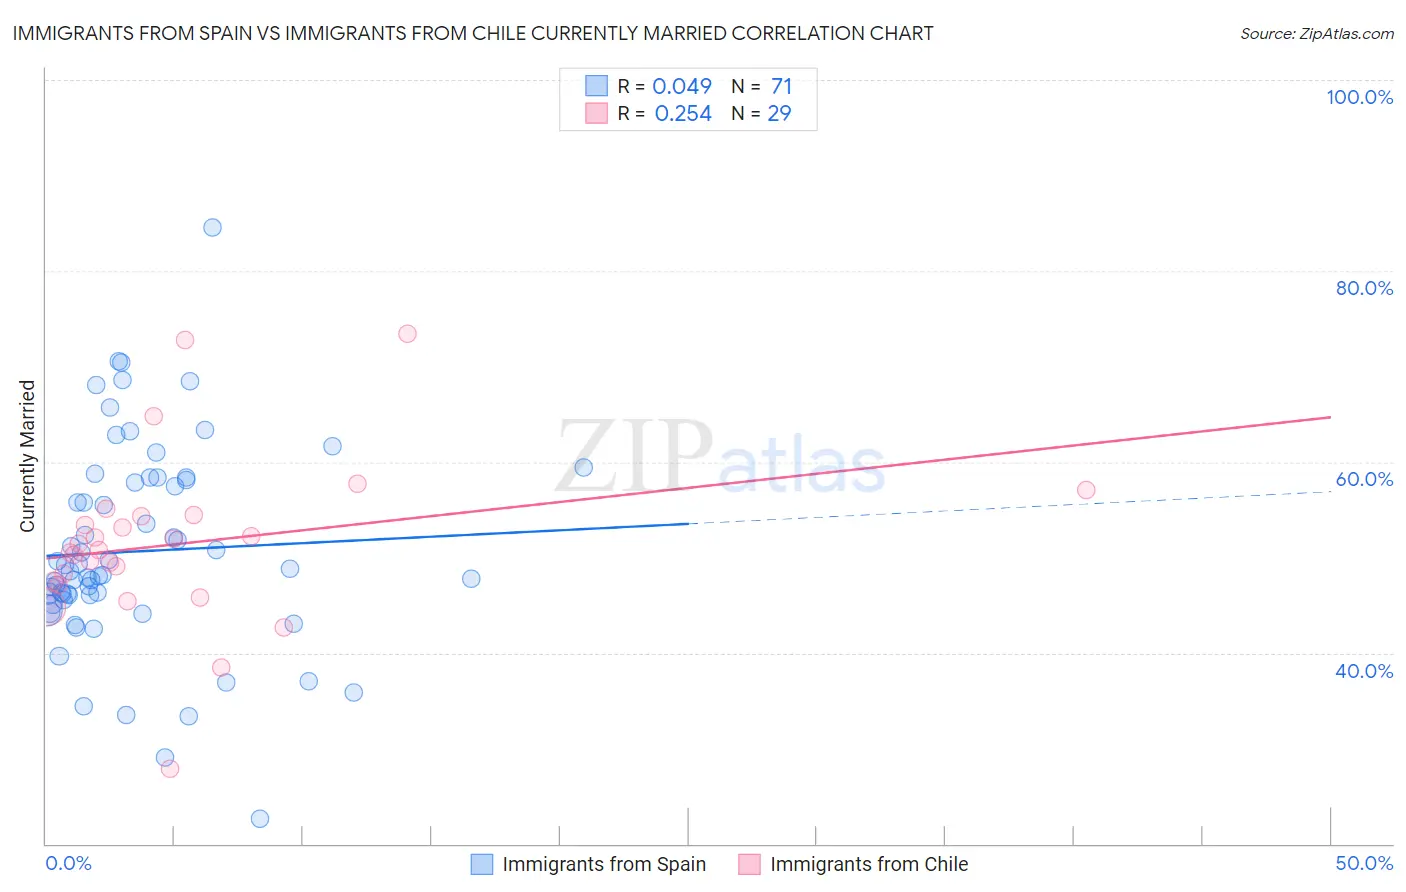
Immigrants from Spain vs Immigrants from Chile Currently Married Correlation Chart
The statistical analysis conducted on geographies consisting of 239,655,163 people shows no correlation between the proportion of Immigrants from Spain and percentage of population currently married in the United States with a correlation coefficient (R) of 0.049 and weighted average of 45.8%. Similarly, the statistical analysis conducted on geographies consisting of 218,644,057 people shows a weak positive correlation between the proportion of Immigrants from Chile and percentage of population currently married in the United States with a correlation coefficient (R) of 0.254 and weighted average of 46.4%, a difference of 1.4%.
Currently Married Correlation Summary
| Measurement | Immigrants from Spain | Immigrants from Chile |
| Minimum | 22.6% | 27.8% |
| Maximum | 84.5% | 73.4% |
| Range | 61.9% | 45.6% |
| Mean | 50.6% | 51.4% |
| Median | 48.6% | 50.8% |
| Interquartile 25% (IQ1) | 45.5% | 47.3% |
| Interquartile 75% (IQ3) | 58.1% | 54.4% |
| Interquartile Range (IQR) | 12.6% | 7.0% |
| Standard Deviation (Sample) | 10.6% | 8.9% |
| Standard Deviation (Population) | 10.5% | 8.7% |
Demographics Similar to Immigrants from Spain and Immigrants from Chile by Currently Married
In terms of currently married, the demographic groups most similar to Immigrants from Spain are Taiwanese (45.8%, a difference of 0.010%), South American Indian (45.8%, a difference of 0.020%), Immigrants from Albania (45.9%, a difference of 0.24%), Malaysian (45.9%, a difference of 0.30%), and Creek (46.0%, a difference of 0.43%). Similarly, the demographic groups most similar to Immigrants from Chile are Mongolian (46.4%, a difference of 0.030%), Immigrants from Peru (46.4%, a difference of 0.060%), Colombian (46.3%, a difference of 0.20%), Fijian (46.3%, a difference of 0.27%), and Choctaw (46.3%, a difference of 0.32%).
| Demographics | Rating | Rank | Currently Married |
| Mongolians | 37.6 /100 | #185 | Fair 46.4% |
| Immigrants | Chile | 36.8 /100 | #186 | Fair 46.4% |
| Immigrants | Peru | 35.3 /100 | #187 | Fair 46.4% |
| Colombians | 31.8 /100 | #188 | Fair 46.3% |
| Fijians | 30.3 /100 | #189 | Fair 46.3% |
| Choctaw | 29.1 /100 | #190 | Fair 46.3% |
| Immigrants | France | 27.7 /100 | #191 | Fair 46.2% |
| Soviet Union | 25.7 /100 | #192 | Fair 46.2% |
| Immigrants | Fiji | 25.0 /100 | #193 | Fair 46.2% |
| South Americans | 23.8 /100 | #194 | Fair 46.1% |
| Immigrants | Nepal | 23.7 /100 | #195 | Fair 46.1% |
| Immigrants | Bosnia and Herzegovina | 22.2 /100 | #196 | Fair 46.1% |
| Immigrants | Kuwait | 21.7 /100 | #197 | Fair 46.1% |
| Immigrants | Colombia | 21.0 /100 | #198 | Fair 46.1% |
| Immigrants | Costa Rica | 19.6 /100 | #199 | Poor 46.0% |
| Creek | 17.2 /100 | #200 | Poor 46.0% |
| Malaysians | 15.3 /100 | #201 | Poor 45.9% |
| Immigrants | Albania | 14.5 /100 | #202 | Poor 45.9% |
| Taiwanese | 11.7 /100 | #203 | Poor 45.8% |
| Immigrants | Spain | 11.6 /100 | #204 | Poor 45.8% |
| South American Indians | 11.5 /100 | #205 | Poor 45.8% |