Palestinian vs Laotian Divorced or Separated
COMPARE
Palestinian
Laotian
Divorced or Separated
Divorced or Separated Comparison
Palestinians
Laotians
11.5%
DIVORCED OR SEPARATED
99.7/ 100
METRIC RATING
68th/ 347
METRIC RANK
11.2%
DIVORCED OR SEPARATED
100.0/ 100
METRIC RATING
46th/ 347
METRIC RANK
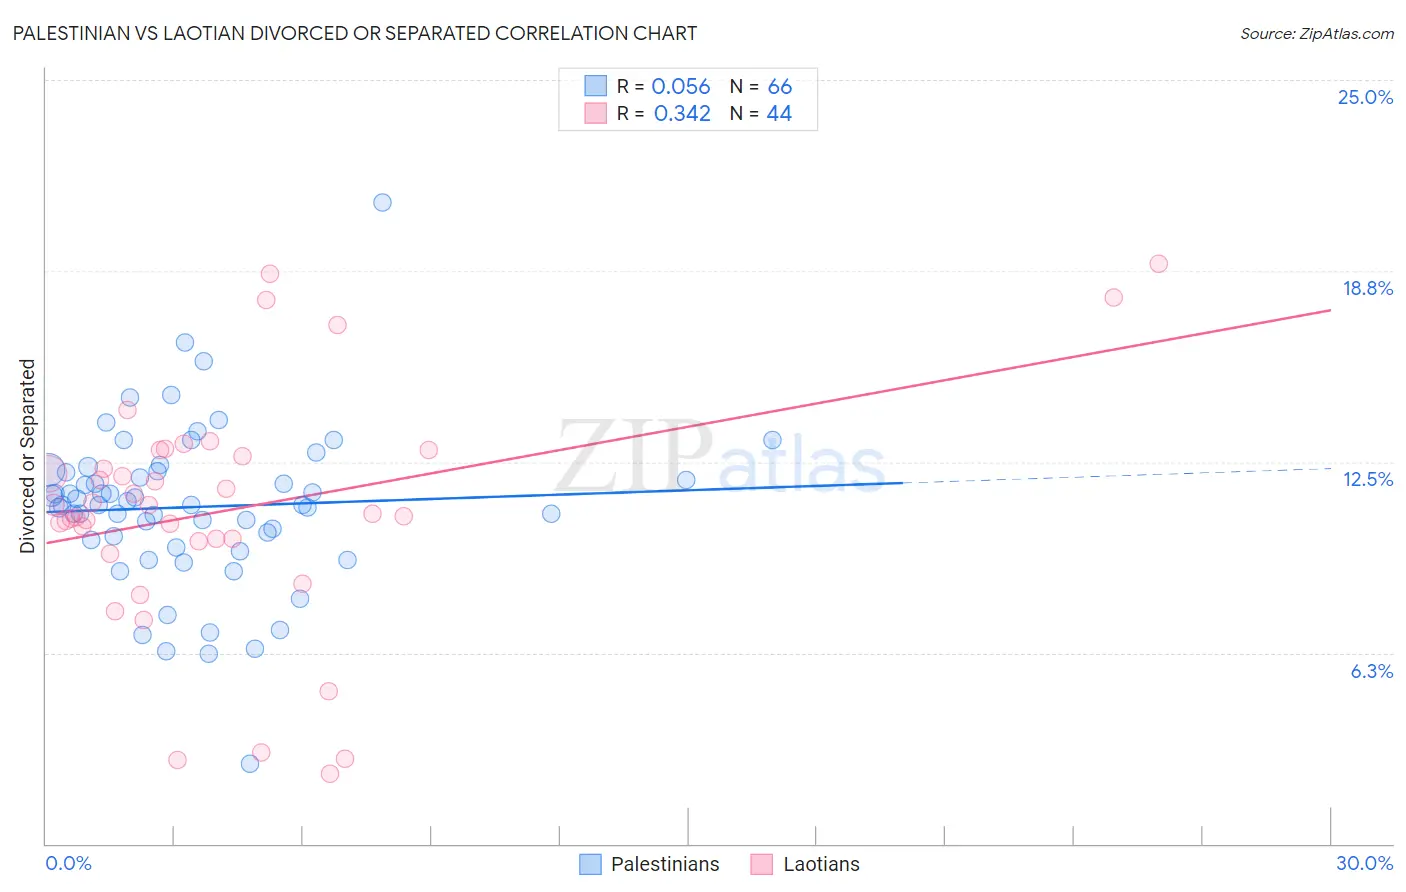
Palestinian vs Laotian Divorced or Separated Correlation Chart
The statistical analysis conducted on geographies consisting of 216,394,525 people shows a slight positive correlation between the proportion of Palestinians and percentage of population currently divorced or separated in the United States with a correlation coefficient (R) of 0.056 and weighted average of 11.5%. Similarly, the statistical analysis conducted on geographies consisting of 224,772,196 people shows a mild positive correlation between the proportion of Laotians and percentage of population currently divorced or separated in the United States with a correlation coefficient (R) of 0.342 and weighted average of 11.2%, a difference of 2.2%.
Divorced or Separated Correlation Summary
| Measurement | Palestinian | Laotian |
| Minimum | 2.6% | 2.3% |
| Maximum | 21.0% | 19.0% |
| Range | 18.4% | 16.7% |
| Mean | 11.0% | 10.9% |
| Median | 11.1% | 10.9% |
| Interquartile 25% (IQ1) | 9.9% | 9.9% |
| Interquartile 75% (IQ3) | 12.2% | 12.8% |
| Interquartile Range (IQR) | 2.3% | 2.9% |
| Standard Deviation (Sample) | 2.7% | 3.9% |
| Standard Deviation (Population) | 2.7% | 3.8% |
Similar Demographics by Divorced or Separated
Demographics Similar to Palestinians by Divorced or Separated
In terms of divorced or separated, the demographic groups most similar to Palestinians are Immigrants from Belgium (11.5%, a difference of 0.0%), Immigrants from Eastern Europe (11.5%, a difference of 0.020%), Immigrants from Syria (11.4%, a difference of 0.11%), Paraguayan (11.5%, a difference of 0.12%), and Jordanian (11.5%, a difference of 0.18%).
| Demographics | Rating | Rank | Divorced or Separated |
| Koreans | 99.9 /100 | #61 | Exceptional 11.3% |
| Luxembourgers | 99.9 /100 | #62 | Exceptional 11.3% |
| Immigrants | Kuwait | 99.9 /100 | #63 | Exceptional 11.3% |
| Macedonians | 99.8 /100 | #64 | Exceptional 11.4% |
| Immigrants | South Eastern Asia | 99.8 /100 | #65 | Exceptional 11.4% |
| Inupiat | 99.8 /100 | #66 | Exceptional 11.4% |
| Immigrants | Syria | 99.7 /100 | #67 | Exceptional 11.4% |
| Palestinians | 99.7 /100 | #68 | Exceptional 11.5% |
| Immigrants | Belgium | 99.7 /100 | #69 | Exceptional 11.5% |
| Immigrants | Eastern Europe | 99.7 /100 | #70 | Exceptional 11.5% |
| Paraguayans | 99.7 /100 | #71 | Exceptional 11.5% |
| Jordanians | 99.6 /100 | #72 | Exceptional 11.5% |
| Immigrants | North Macedonia | 99.6 /100 | #73 | Exceptional 11.5% |
| Taiwanese | 99.6 /100 | #74 | Exceptional 11.5% |
| Immigrants | Northern Africa | 99.6 /100 | #75 | Exceptional 11.5% |
Demographics Similar to Laotians by Divorced or Separated
In terms of divorced or separated, the demographic groups most similar to Laotians are Immigrants from Poland (11.2%, a difference of 0.010%), Immigrants from Turkey (11.2%, a difference of 0.040%), Immigrants from Saudi Arabia (11.2%, a difference of 0.050%), Turkish (11.2%, a difference of 0.11%), and Bolivian (11.2%, a difference of 0.12%).
| Demographics | Rating | Rank | Divorced or Separated |
| Immigrants | Egypt | 100.0 /100 | #39 | Exceptional 11.1% |
| Soviet Union | 100.0 /100 | #40 | Exceptional 11.1% |
| Bhutanese | 100.0 /100 | #41 | Exceptional 11.2% |
| Chinese | 100.0 /100 | #42 | Exceptional 11.2% |
| Immigrants | Belarus | 100.0 /100 | #43 | Exceptional 11.2% |
| Immigrants | Western Asia | 100.0 /100 | #44 | Exceptional 11.2% |
| Turks | 100.0 /100 | #45 | Exceptional 11.2% |
| Laotians | 100.0 /100 | #46 | Exceptional 11.2% |
| Immigrants | Poland | 100.0 /100 | #47 | Exceptional 11.2% |
| Immigrants | Turkey | 100.0 /100 | #48 | Exceptional 11.2% |
| Immigrants | Saudi Arabia | 100.0 /100 | #49 | Exceptional 11.2% |
| Bolivians | 100.0 /100 | #50 | Exceptional 11.2% |
| Immigrants | Bolivia | 100.0 /100 | #51 | Exceptional 11.3% |
| Immigrants | Australia | 99.9 /100 | #52 | Exceptional 11.3% |
| Immigrants | Lithuania | 99.9 /100 | #53 | Exceptional 11.3% |