Immigrants from Israel vs Danish Single Father Households
COMPARE
Immigrants from Israel
Danish
Single Father Households
Single Father Households Comparison
Immigrants from Israel
Danes
1.8%
SINGLE FATHER HOUSEHOLDS
100.0/ 100
METRIC RATING
2nd/ 347
METRIC RANK
2.3%
SINGLE FATHER HOUSEHOLDS
48.2/ 100
METRIC RATING
176th/ 347
METRIC RANK
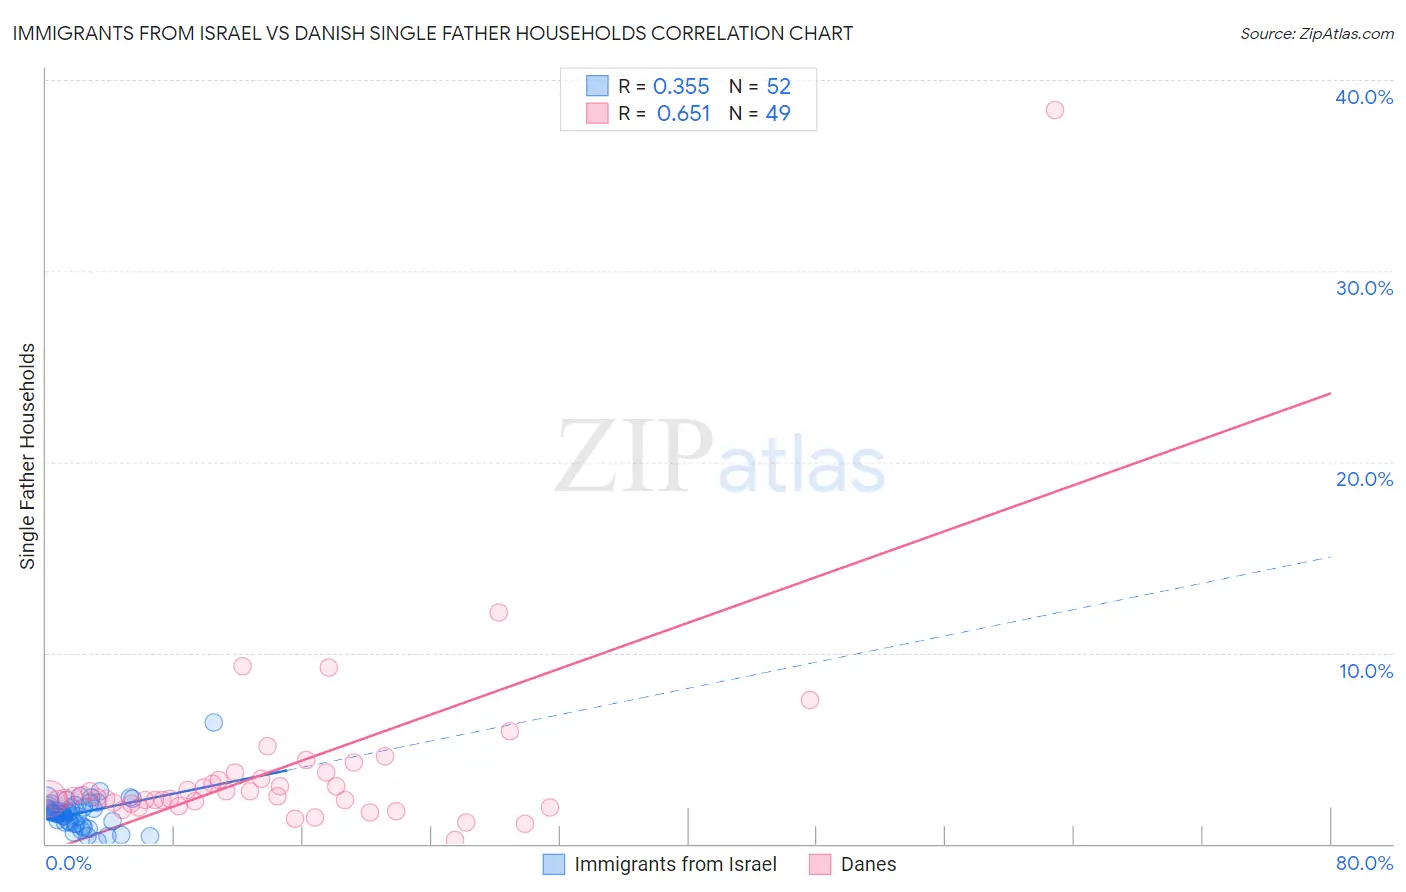
Immigrants from Israel vs Danish Single Father Households Correlation Chart
The statistical analysis conducted on geographies consisting of 208,787,114 people shows a mild positive correlation between the proportion of Immigrants from Israel and percentage of single father households in the United States with a correlation coefficient (R) of 0.355 and weighted average of 1.8%. Similarly, the statistical analysis conducted on geographies consisting of 466,880,679 people shows a significant positive correlation between the proportion of Danes and percentage of single father households in the United States with a correlation coefficient (R) of 0.651 and weighted average of 2.3%, a difference of 30.4%.
Single Father Households Correlation Summary
| Measurement | Immigrants from Israel | Danish |
| Minimum | 0.13% | 0.21% |
| Maximum | 6.3% | 38.5% |
| Range | 6.2% | 38.2% |
| Mean | 1.6% | 3.9% |
| Median | 1.6% | 2.5% |
| Interquartile 25% (IQ1) | 1.1% | 2.1% |
| Interquartile 75% (IQ3) | 1.9% | 3.6% |
| Interquartile Range (IQR) | 0.80% | 1.5% |
| Standard Deviation (Sample) | 0.91% | 5.5% |
| Standard Deviation (Population) | 0.90% | 5.5% |
Similar Demographics by Single Father Households
Demographics Similar to Immigrants from Israel by Single Father Households
In terms of single father households, the demographic groups most similar to Immigrants from Israel are Soviet Union (1.8%, a difference of 0.040%), Filipino (1.8%, a difference of 0.42%), Immigrants from Uzbekistan (1.8%, a difference of 1.1%), Immigrants from Hong Kong (1.8%, a difference of 2.0%), and Immigrants from Taiwan (1.8%, a difference of 2.4%).
| Demographics | Rating | Rank | Single Father Households |
| Soviet Union | 100.0 /100 | #1 | Exceptional 1.8% |
| Immigrants | Israel | 100.0 /100 | #2 | Exceptional 1.8% |
| Filipinos | 100.0 /100 | #3 | Exceptional 1.8% |
| Immigrants | Uzbekistan | 100.0 /100 | #4 | Exceptional 1.8% |
| Immigrants | Hong Kong | 100.0 /100 | #5 | Exceptional 1.8% |
| Immigrants | Taiwan | 100.0 /100 | #6 | Exceptional 1.8% |
| Cypriots | 100.0 /100 | #7 | Exceptional 1.8% |
| Immigrants | Ireland | 100.0 /100 | #8 | Exceptional 1.8% |
| Immigrants | China | 100.0 /100 | #9 | Exceptional 1.8% |
| Okinawans | 100.0 /100 | #10 | Exceptional 1.9% |
| Immigrants | Belarus | 100.0 /100 | #11 | Exceptional 1.9% |
| Immigrants | Greece | 100.0 /100 | #12 | Exceptional 1.9% |
| Immigrants | Singapore | 100.0 /100 | #13 | Exceptional 1.9% |
| Immigrants | Lithuania | 100.0 /100 | #14 | Exceptional 1.9% |
| Immigrants | Eastern Asia | 100.0 /100 | #15 | Exceptional 1.9% |
Demographics Similar to Danes by Single Father Households
In terms of single father households, the demographic groups most similar to Danes are Colombian (2.3%, a difference of 0.010%), Immigrants from Jamaica (2.3%, a difference of 0.060%), Afghan (2.3%, a difference of 0.13%), Costa Rican (2.3%, a difference of 0.31%), and Welsh (2.3%, a difference of 0.31%).
| Demographics | Rating | Rank | Single Father Households |
| Czechs | 62.5 /100 | #169 | Good 2.3% |
| Ugandans | 62.2 /100 | #170 | Good 2.3% |
| Swedes | 61.6 /100 | #171 | Good 2.3% |
| Czechoslovakians | 58.9 /100 | #172 | Average 2.3% |
| Celtics | 55.4 /100 | #173 | Average 2.3% |
| Afghans | 50.0 /100 | #174 | Average 2.3% |
| Immigrants | Jamaica | 49.1 /100 | #175 | Average 2.3% |
| Danes | 48.2 /100 | #176 | Average 2.3% |
| Colombians | 48.0 /100 | #177 | Average 2.3% |
| Costa Ricans | 44.1 /100 | #178 | Average 2.3% |
| Welsh | 44.0 /100 | #179 | Average 2.3% |
| Yugoslavians | 43.9 /100 | #180 | Average 2.3% |
| Jamaicans | 43.5 /100 | #181 | Average 2.3% |
| Belgians | 43.3 /100 | #182 | Average 2.3% |
| Immigrants | Panama | 41.8 /100 | #183 | Average 2.4% |