Okinawan vs Colombian Currently Married
COMPARE
Okinawan
Colombian
Currently Married
Currently Married Comparison
Okinawans
Colombians
47.4%
CURRENTLY MARRIED
85.3/ 100
METRIC RATING
125th/ 347
METRIC RANK
46.3%
CURRENTLY MARRIED
31.8/ 100
METRIC RATING
188th/ 347
METRIC RANK
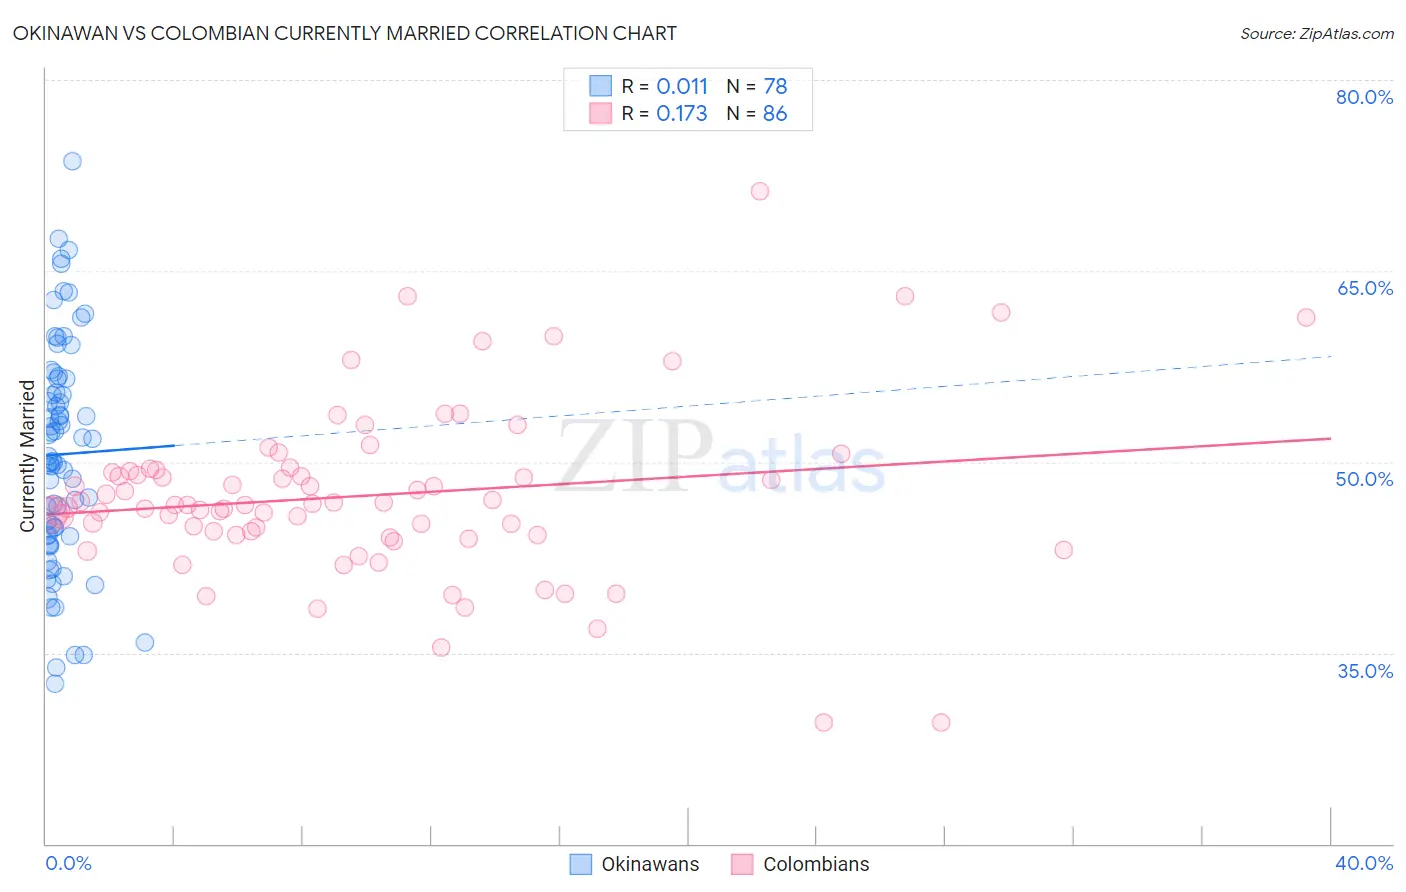
Okinawan vs Colombian Currently Married Correlation Chart
The statistical analysis conducted on geographies consisting of 73,772,528 people shows no correlation between the proportion of Okinawans and percentage of population currently married in the United States with a correlation coefficient (R) of 0.011 and weighted average of 47.4%. Similarly, the statistical analysis conducted on geographies consisting of 419,624,806 people shows a poor positive correlation between the proportion of Colombians and percentage of population currently married in the United States with a correlation coefficient (R) of 0.173 and weighted average of 46.3%, a difference of 2.3%.
Currently Married Correlation Summary
| Measurement | Okinawan | Colombian |
| Minimum | 32.6% | 29.5% |
| Maximum | 73.6% | 71.3% |
| Range | 41.0% | 41.8% |
| Mean | 50.6% | 47.4% |
| Median | 50.2% | 46.6% |
| Interquartile 25% (IQ1) | 44.2% | 44.3% |
| Interquartile 75% (IQ3) | 56.5% | 49.3% |
| Interquartile Range (IQR) | 12.3% | 5.0% |
| Standard Deviation (Sample) | 8.7% | 6.8% |
| Standard Deviation (Population) | 8.7% | 6.7% |
Similar Demographics by Currently Married
Demographics Similar to Okinawans by Currently Married
In terms of currently married, the demographic groups most similar to Okinawans are Immigrants from Jordan (47.4%, a difference of 0.030%), New Zealander (47.4%, a difference of 0.030%), Portuguese (47.3%, a difference of 0.080%), Laotian (47.4%, a difference of 0.10%), and Sri Lankan (47.3%, a difference of 0.14%).
| Demographics | Rating | Rank | Currently Married |
| Immigrants | Philippines | 90.2 /100 | #118 | Exceptional 47.6% |
| Australians | 90.2 /100 | #119 | Exceptional 47.6% |
| Syrians | 88.9 /100 | #120 | Excellent 47.5% |
| Immigrants | Croatia | 88.6 /100 | #121 | Excellent 47.5% |
| Osage | 87.9 /100 | #122 | Excellent 47.5% |
| Immigrants | Kazakhstan | 87.2 /100 | #123 | Excellent 47.4% |
| Laotians | 86.6 /100 | #124 | Excellent 47.4% |
| Okinawans | 85.3 /100 | #125 | Excellent 47.4% |
| Immigrants | Jordan | 84.9 /100 | #126 | Excellent 47.4% |
| New Zealanders | 84.9 /100 | #127 | Excellent 47.4% |
| Portuguese | 84.2 /100 | #128 | Excellent 47.3% |
| Sri Lankans | 83.2 /100 | #129 | Excellent 47.3% |
| Immigrants | Iraq | 82.8 /100 | #130 | Excellent 47.3% |
| Icelanders | 82.4 /100 | #131 | Excellent 47.3% |
| Afghans | 81.8 /100 | #132 | Excellent 47.3% |
Demographics Similar to Colombians by Currently Married
In terms of currently married, the demographic groups most similar to Colombians are Fijian (46.3%, a difference of 0.060%), Choctaw (46.3%, a difference of 0.12%), Immigrants from Peru (46.4%, a difference of 0.14%), Immigrants from France (46.2%, a difference of 0.18%), and Immigrants from Chile (46.4%, a difference of 0.20%).
| Demographics | Rating | Rank | Currently Married |
| Ottawa | 43.0 /100 | #181 | Average 46.5% |
| Potawatomi | 41.9 /100 | #182 | Average 46.5% |
| Immigrants | Northern Africa | 39.7 /100 | #183 | Fair 46.5% |
| Brazilians | 39.3 /100 | #184 | Fair 46.4% |
| Mongolians | 37.6 /100 | #185 | Fair 46.4% |
| Immigrants | Chile | 36.8 /100 | #186 | Fair 46.4% |
| Immigrants | Peru | 35.3 /100 | #187 | Fair 46.4% |
| Colombians | 31.8 /100 | #188 | Fair 46.3% |
| Fijians | 30.3 /100 | #189 | Fair 46.3% |
| Choctaw | 29.1 /100 | #190 | Fair 46.3% |
| Immigrants | France | 27.7 /100 | #191 | Fair 46.2% |
| Soviet Union | 25.7 /100 | #192 | Fair 46.2% |
| Immigrants | Fiji | 25.0 /100 | #193 | Fair 46.2% |
| South Americans | 23.8 /100 | #194 | Fair 46.1% |
| Immigrants | Nepal | 23.7 /100 | #195 | Fair 46.1% |