Immigrants from South America vs Spanish American Currently Married
COMPARE
Immigrants from South America
Spanish American
Currently Married
Currently Married Comparison
Immigrants from South America
Spanish Americans
45.7%
CURRENTLY MARRIED
10.8/ 100
METRIC RATING
207th/ 347
METRIC RANK
45.0%
CURRENTLY MARRIED
2.1/ 100
METRIC RATING
227th/ 347
METRIC RANK
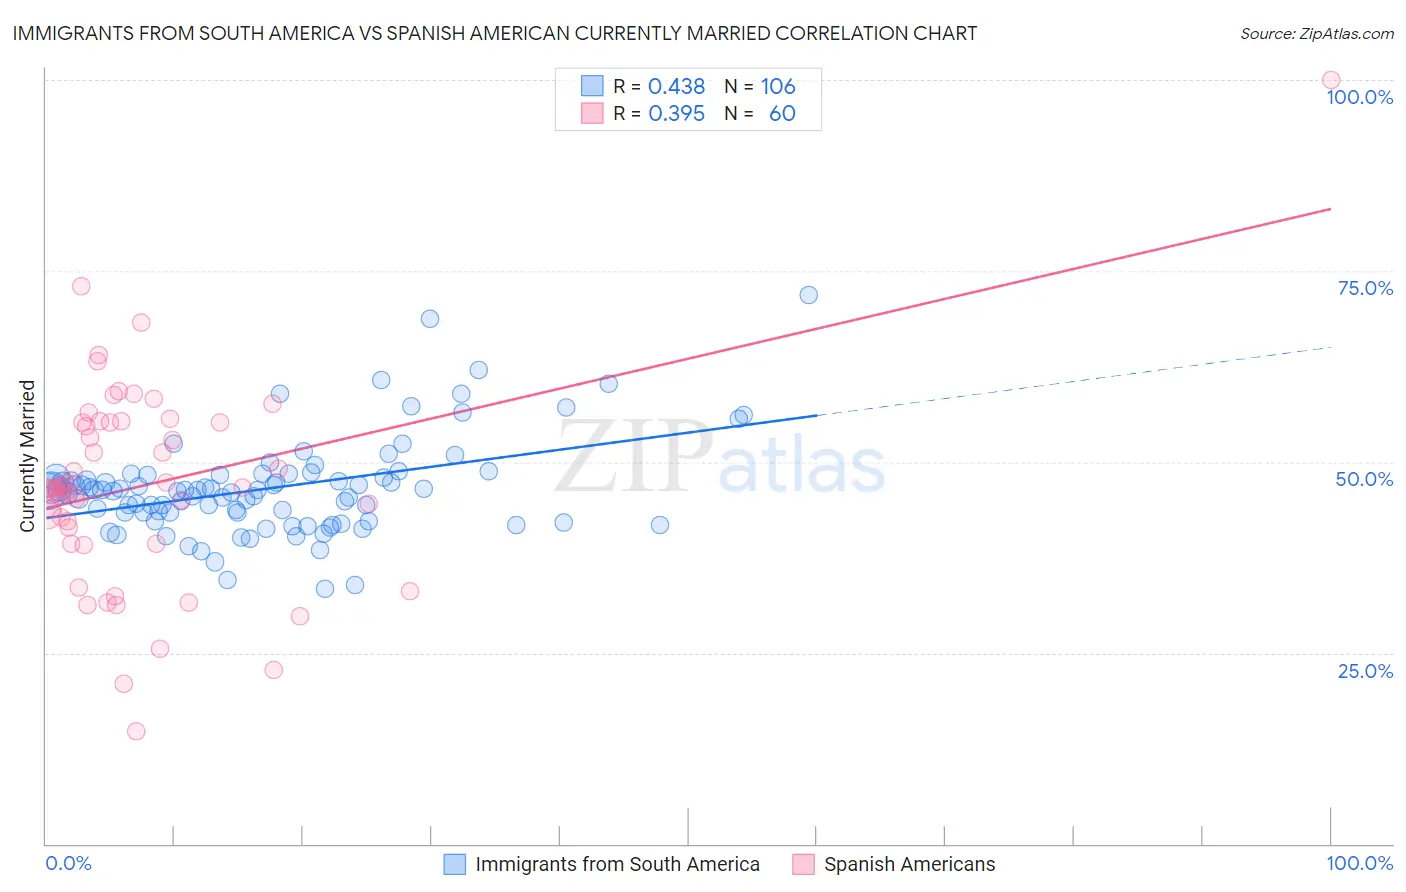
Immigrants from South America vs Spanish American Currently Married Correlation Chart
The statistical analysis conducted on geographies consisting of 486,361,884 people shows a moderate positive correlation between the proportion of Immigrants from South America and percentage of population currently married in the United States with a correlation coefficient (R) of 0.438 and weighted average of 45.7%. Similarly, the statistical analysis conducted on geographies consisting of 103,168,407 people shows a mild positive correlation between the proportion of Spanish Americans and percentage of population currently married in the United States with a correlation coefficient (R) of 0.395 and weighted average of 45.0%, a difference of 1.7%.
Currently Married Correlation Summary
| Measurement | Immigrants from South America | Spanish American |
| Minimum | 33.3% | 14.8% |
| Maximum | 71.9% | 100.0% |
| Range | 38.6% | 85.2% |
| Mean | 46.5% | 47.0% |
| Median | 46.2% | 46.6% |
| Interquartile 25% (IQ1) | 43.3% | 40.4% |
| Interquartile 75% (IQ3) | 48.3% | 55.2% |
| Interquartile Range (IQR) | 4.9% | 14.8% |
| Standard Deviation (Sample) | 6.3% | 13.5% |
| Standard Deviation (Population) | 6.3% | 13.4% |
Demographics Similar to Immigrants from South America and Spanish Americans by Currently Married
In terms of currently married, the demographic groups most similar to Immigrants from South America are Alsatian (45.7%, a difference of 0.010%), Immigrants from Micronesia (45.6%, a difference of 0.22%), Uruguayan (45.6%, a difference of 0.33%), Houma (45.5%, a difference of 0.42%), and Marshallese (45.5%, a difference of 0.42%). Similarly, the demographic groups most similar to Spanish Americans are Comanche (45.0%, a difference of 0.0%), French American Indian (45.0%, a difference of 0.050%), Immigrants from Uganda (45.0%, a difference of 0.060%), Immigrants from Laos (45.0%, a difference of 0.10%), and Immigrants from the Azores (45.1%, a difference of 0.18%).
| Demographics | Rating | Rank | Currently Married |
| Immigrants | South America | 10.8 /100 | #207 | Poor 45.7% |
| Alsatians | 10.8 /100 | #208 | Poor 45.7% |
| Immigrants | Micronesia | 8.8 /100 | #209 | Tragic 45.6% |
| Uruguayans | 7.9 /100 | #210 | Tragic 45.6% |
| Houma | 7.2 /100 | #211 | Tragic 45.5% |
| Marshallese | 7.2 /100 | #212 | Tragic 45.5% |
| Alaska Natives | 7.0 /100 | #213 | Tragic 45.5% |
| Dutch West Indians | 6.7 /100 | #214 | Tragic 45.5% |
| German Russians | 6.7 /100 | #215 | Tragic 45.5% |
| Immigrants | Morocco | 5.5 /100 | #216 | Tragic 45.4% |
| Immigrants | Thailand | 5.1 /100 | #217 | Tragic 45.4% |
| Panamanians | 4.0 /100 | #218 | Tragic 45.3% |
| Immigrants | Portugal | 3.5 /100 | #219 | Tragic 45.2% |
| Kenyans | 3.1 /100 | #220 | Tragic 45.2% |
| Mexicans | 3.0 /100 | #221 | Tragic 45.2% |
| Immigrants | Azores | 2.5 /100 | #222 | Tragic 45.1% |
| Immigrants | Laos | 2.3 /100 | #223 | Tragic 45.0% |
| Immigrants | Uganda | 2.2 /100 | #224 | Tragic 45.0% |
| French American Indians | 2.2 /100 | #225 | Tragic 45.0% |
| Comanche | 2.1 /100 | #226 | Tragic 45.0% |
| Spanish Americans | 2.1 /100 | #227 | Tragic 45.0% |