Norwegian vs Spanish American Unemployment Among Ages 35 to 44 years
COMPARE
Norwegian
Spanish American
Unemployment Among Ages 35 to 44 years
Unemployment Among Ages 35 to 44 years Comparison
Norwegians
Spanish Americans
4.0%
UNEMPLOYMENT AMONG AGES 35 TO 44 YEARS
100.0/ 100
METRIC RATING
3rd/ 347
METRIC RANK
5.3%
UNEMPLOYMENT AMONG AGES 35 TO 44 YEARS
0.1/ 100
METRIC RATING
261st/ 347
METRIC RANK
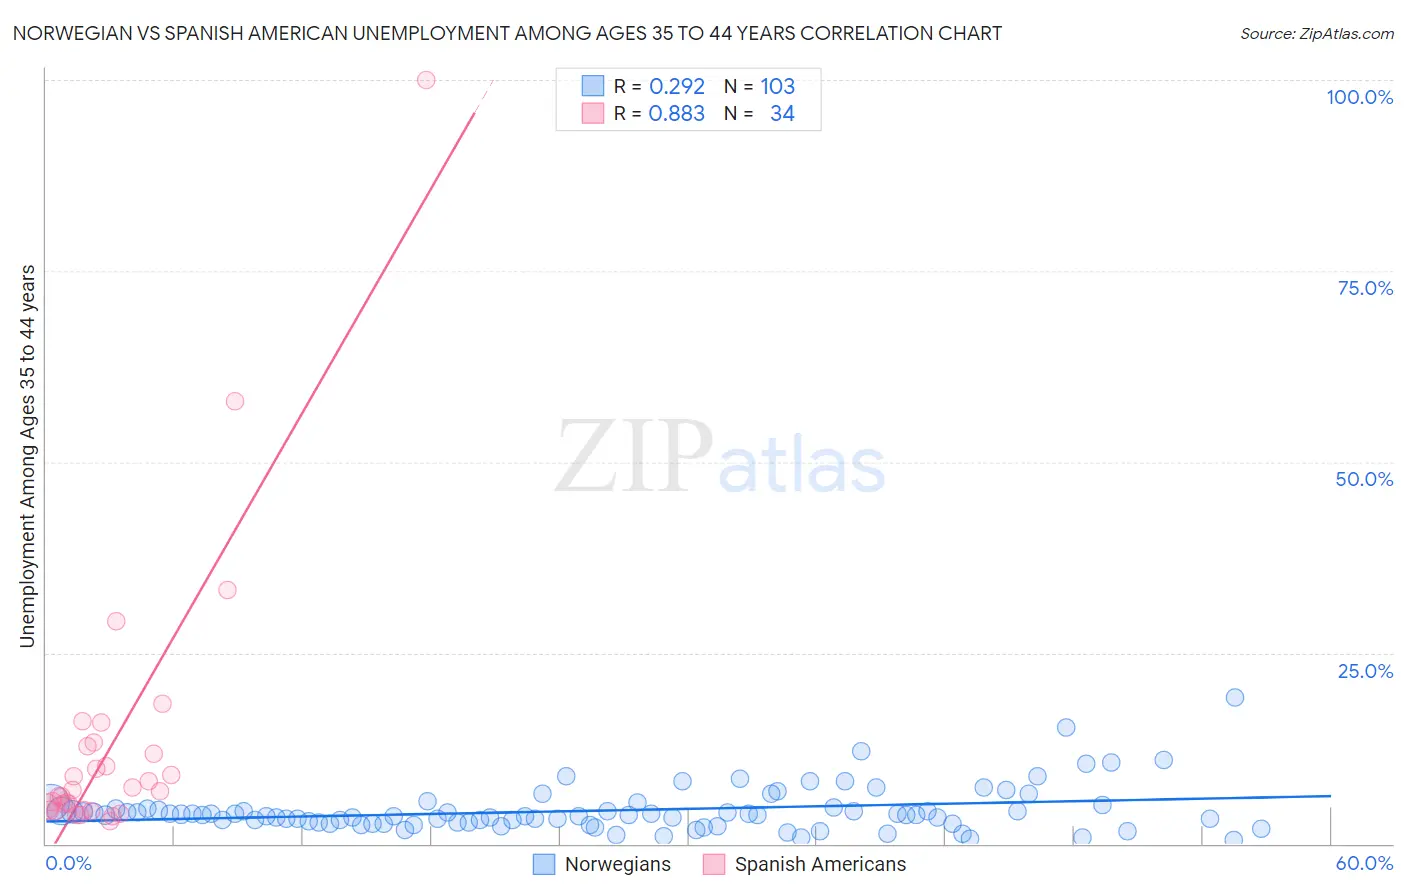
Norwegian vs Spanish American Unemployment Among Ages 35 to 44 years Correlation Chart
The statistical analysis conducted on geographies consisting of 502,780,015 people shows a weak positive correlation between the proportion of Norwegians and unemployment rate among population between the ages 35 and 44 in the United States with a correlation coefficient (R) of 0.292 and weighted average of 4.0%. Similarly, the statistical analysis conducted on geographies consisting of 102,531,824 people shows a very strong positive correlation between the proportion of Spanish Americans and unemployment rate among population between the ages 35 and 44 in the United States with a correlation coefficient (R) of 0.883 and weighted average of 5.3%, a difference of 32.2%.
Unemployment Among Ages 35 to 44 years Correlation Summary
| Measurement | Norwegian | Spanish American |
| Minimum | 0.50% | 2.9% |
| Maximum | 19.2% | 100.0% |
| Range | 18.7% | 97.1% |
| Mean | 4.4% | 13.2% |
| Median | 3.8% | 7.0% |
| Interquartile 25% (IQ1) | 2.8% | 4.5% |
| Interquartile 75% (IQ3) | 4.5% | 12.8% |
| Interquartile Range (IQR) | 1.8% | 8.3% |
| Standard Deviation (Sample) | 2.9% | 18.8% |
| Standard Deviation (Population) | 2.9% | 18.5% |
Similar Demographics by Unemployment Among Ages 35 to 44 years
Demographics Similar to Norwegians by Unemployment Among Ages 35 to 44 years
In terms of unemployment among ages 35 to 44 years, the demographic groups most similar to Norwegians are Immigrants from Taiwan (4.0%, a difference of 0.56%), Filipino (4.0%, a difference of 1.2%), Immigrants from Venezuela (4.0%, a difference of 1.3%), Thai (3.9%, a difference of 1.4%), and Immigrants from Cuba (4.1%, a difference of 2.1%).
| Demographics | Rating | Rank | Unemployment Among Ages 35 to 44 years |
| Immigrants | India | 100.0 /100 | #1 | Exceptional 3.8% |
| Thais | 100.0 /100 | #2 | Exceptional 3.9% |
| Norwegians | 100.0 /100 | #3 | Exceptional 4.0% |
| Immigrants | Taiwan | 100.0 /100 | #4 | Exceptional 4.0% |
| Filipinos | 100.0 /100 | #5 | Exceptional 4.0% |
| Immigrants | Venezuela | 100.0 /100 | #6 | Exceptional 4.0% |
| Immigrants | Cuba | 99.9 /100 | #7 | Exceptional 4.1% |
| Immigrants | South Central Asia | 99.9 /100 | #8 | Exceptional 4.1% |
| Danes | 99.9 /100 | #9 | Exceptional 4.1% |
| Immigrants | Singapore | 99.9 /100 | #10 | Exceptional 4.1% |
| Sudanese | 99.9 /100 | #11 | Exceptional 4.1% |
| Venezuelans | 99.9 /100 | #12 | Exceptional 4.1% |
| Bolivians | 99.9 /100 | #13 | Exceptional 4.1% |
| Czechs | 99.9 /100 | #14 | Exceptional 4.1% |
| Tongans | 99.8 /100 | #15 | Exceptional 4.2% |
Demographics Similar to Spanish Americans by Unemployment Among Ages 35 to 44 years
In terms of unemployment among ages 35 to 44 years, the demographic groups most similar to Spanish Americans are Subsaharan African (5.3%, a difference of 0.20%), Mexican (5.3%, a difference of 0.23%), Immigrants from Latin America (5.3%, a difference of 0.33%), Immigrants from Fiji (5.3%, a difference of 0.44%), and Immigrants from Central America (5.3%, a difference of 0.47%).
| Demographics | Rating | Rank | Unemployment Among Ages 35 to 44 years |
| Immigrants | Bahamas | 0.2 /100 | #254 | Tragic 5.2% |
| Cherokee | 0.2 /100 | #255 | Tragic 5.2% |
| Seminole | 0.1 /100 | #256 | Tragic 5.2% |
| Immigrants | Fiji | 0.1 /100 | #257 | Tragic 5.3% |
| Immigrants | Latin America | 0.1 /100 | #258 | Tragic 5.3% |
| Mexicans | 0.1 /100 | #259 | Tragic 5.3% |
| Sub-Saharan Africans | 0.1 /100 | #260 | Tragic 5.3% |
| Spanish Americans | 0.1 /100 | #261 | Tragic 5.3% |
| Immigrants | Central America | 0.1 /100 | #262 | Tragic 5.3% |
| Choctaw | 0.1 /100 | #263 | Tragic 5.3% |
| Ghanaians | 0.1 /100 | #264 | Tragic 5.3% |
| Yaqui | 0.1 /100 | #265 | Tragic 5.3% |
| Immigrants | Bangladesh | 0.1 /100 | #266 | Tragic 5.3% |
| Immigrants | Western Africa | 0.0 /100 | #267 | Tragic 5.3% |
| Hawaiians | 0.0 /100 | #268 | Tragic 5.3% |