Norwegian vs Immigrants from Kenya Disability Age 65 to 74
COMPARE
Norwegian
Immigrants from Kenya
Disability Age 65 to 74
Disability Age 65 to 74 Comparison
Norwegians
Immigrants from Kenya
22.5%
DISABILITY AGE 65 TO 74
92.5/ 100
METRIC RATING
124th/ 347
METRIC RANK
23.8%
DISABILITY AGE 65 TO 74
19.6/ 100
METRIC RATING
209th/ 347
METRIC RANK
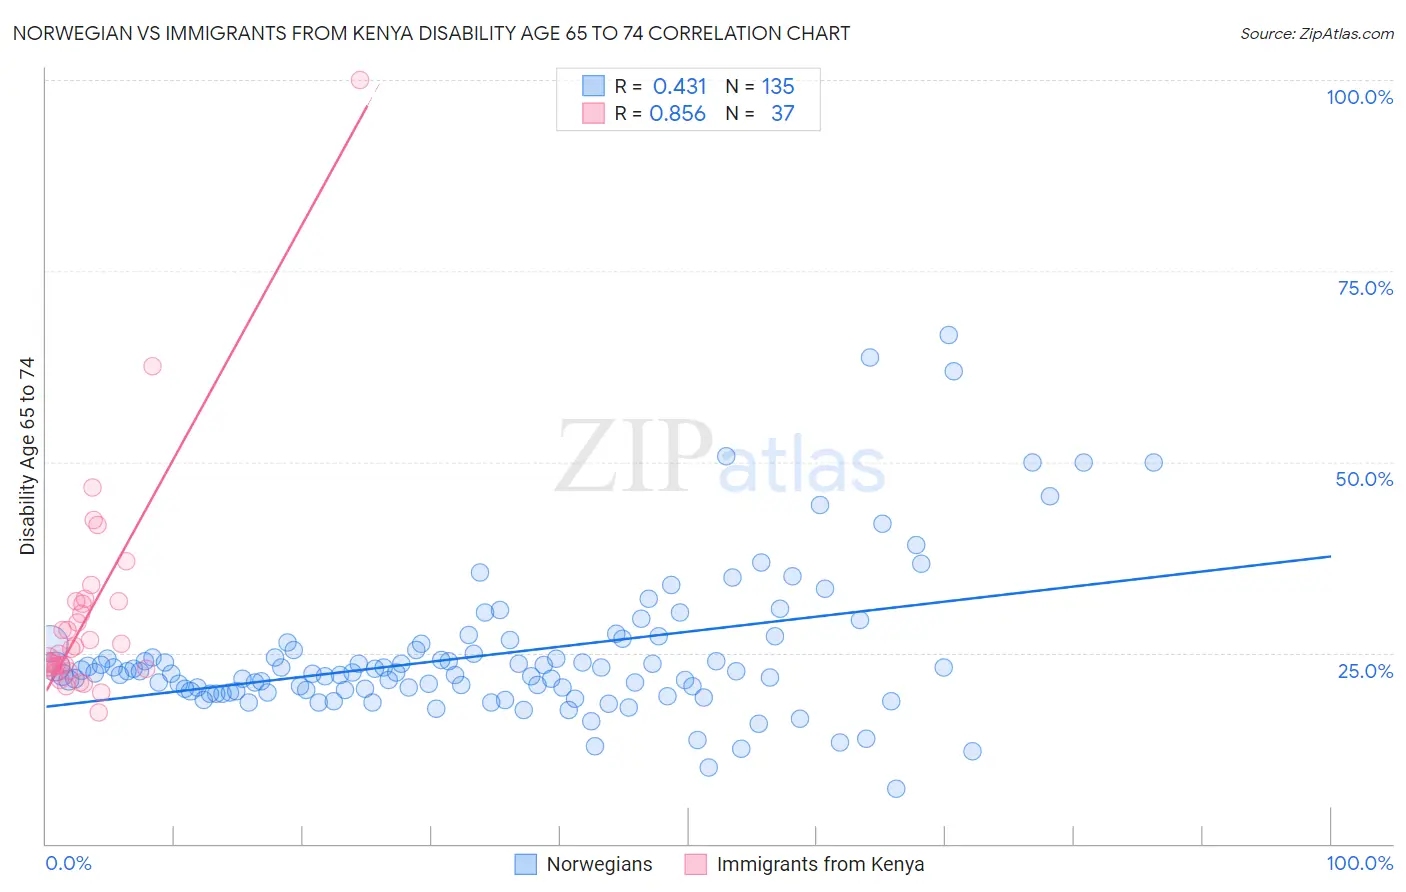
Norwegian vs Immigrants from Kenya Disability Age 65 to 74 Correlation Chart
The statistical analysis conducted on geographies consisting of 531,492,634 people shows a moderate positive correlation between the proportion of Norwegians and percentage of population with a disability between the ages 65 and 75 in the United States with a correlation coefficient (R) of 0.431 and weighted average of 22.5%. Similarly, the statistical analysis conducted on geographies consisting of 217,828,278 people shows a very strong positive correlation between the proportion of Immigrants from Kenya and percentage of population with a disability between the ages 65 and 75 in the United States with a correlation coefficient (R) of 0.856 and weighted average of 23.8%, a difference of 5.9%.
Disability Age 65 to 74 Correlation Summary
| Measurement | Norwegian | Immigrants from Kenya |
| Minimum | 7.1% | 17.1% |
| Maximum | 66.7% | 100.0% |
| Range | 59.5% | 82.9% |
| Mean | 24.8% | 30.1% |
| Median | 22.4% | 25.6% |
| Interquartile 25% (IQ1) | 19.9% | 23.0% |
| Interquartile 75% (IQ3) | 26.1% | 31.8% |
| Interquartile Range (IQR) | 6.2% | 8.8% |
| Standard Deviation (Sample) | 9.6% | 14.7% |
| Standard Deviation (Population) | 9.6% | 14.5% |
Similar Demographics by Disability Age 65 to 74
Demographics Similar to Norwegians by Disability Age 65 to 74
In terms of disability age 65 to 74, the demographic groups most similar to Norwegians are Immigrants from Western Europe (22.5%, a difference of 0.040%), Lebanese (22.5%, a difference of 0.060%), Slovak (22.5%, a difference of 0.17%), Hungarian (22.4%, a difference of 0.19%), and Czech (22.4%, a difference of 0.24%).
| Demographics | Rating | Rank | Disability Age 65 to 74 |
| Swedes | 94.7 /100 | #117 | Exceptional 22.4% |
| Austrians | 94.7 /100 | #118 | Exceptional 22.4% |
| Immigrants | Northern Africa | 94.7 /100 | #119 | Exceptional 22.4% |
| Immigrants | Kazakhstan | 93.9 /100 | #120 | Exceptional 22.4% |
| Czechs | 93.5 /100 | #121 | Exceptional 22.4% |
| Immigrants | Jordan | 93.5 /100 | #122 | Exceptional 22.4% |
| Hungarians | 93.3 /100 | #123 | Exceptional 22.4% |
| Norwegians | 92.5 /100 | #124 | Exceptional 22.5% |
| Immigrants | Western Europe | 92.3 /100 | #125 | Exceptional 22.5% |
| Lebanese | 92.2 /100 | #126 | Exceptional 22.5% |
| Slovaks | 91.6 /100 | #127 | Exceptional 22.5% |
| Immigrants | Costa Rica | 90.4 /100 | #128 | Exceptional 22.6% |
| Immigrants | Uruguay | 90.1 /100 | #129 | Exceptional 22.6% |
| Immigrants | Albania | 90.0 /100 | #130 | Excellent 22.6% |
| Immigrants | Nepal | 89.4 /100 | #131 | Excellent 22.6% |
Demographics Similar to Immigrants from Kenya by Disability Age 65 to 74
In terms of disability age 65 to 74, the demographic groups most similar to Immigrants from Kenya are Immigrants from Barbados (23.8%, a difference of 0.0%), Immigrants from Sudan (23.8%, a difference of 0.050%), Tongan (23.8%, a difference of 0.11%), Immigrants from Jamaica (23.8%, a difference of 0.11%), and Immigrants from Grenada (23.8%, a difference of 0.22%).
| Demographics | Rating | Rank | Disability Age 65 to 74 |
| Immigrants | Bahamas | 23.3 /100 | #202 | Fair 23.7% |
| Kenyans | 23.2 /100 | #203 | Fair 23.7% |
| Immigrants | Grenada | 22.1 /100 | #204 | Fair 23.8% |
| Tongans | 20.8 /100 | #205 | Fair 23.8% |
| Immigrants | Jamaica | 20.7 /100 | #206 | Fair 23.8% |
| Immigrants | Sudan | 20.1 /100 | #207 | Fair 23.8% |
| Immigrants | Barbados | 19.6 /100 | #208 | Poor 23.8% |
| Immigrants | Kenya | 19.6 /100 | #209 | Poor 23.8% |
| Trinidadians and Tobagonians | 16.4 /100 | #210 | Poor 23.9% |
| Immigrants | West Indies | 15.9 /100 | #211 | Poor 23.9% |
| French | 15.7 /100 | #212 | Poor 23.9% |
| Nicaraguans | 14.3 /100 | #213 | Poor 23.9% |
| Immigrants | Oceania | 13.6 /100 | #214 | Poor 24.0% |
| Pennsylvania Germans | 13.3 /100 | #215 | Poor 24.0% |
| Jamaicans | 12.2 /100 | #216 | Poor 24.0% |