Immigrants from Vietnam vs Creek Average Family Size
COMPARE
Immigrants from Vietnam
Creek
Average Family Size
Average Family Size Comparison
Immigrants from Vietnam
Creek
3.38
AVERAGE FAMILY SIZE
100.0/ 100
METRIC RATING
42nd/ 347
METRIC RANK
3.20
AVERAGE FAMILY SIZE
12.1/ 100
METRIC RATING
212th/ 347
METRIC RANK
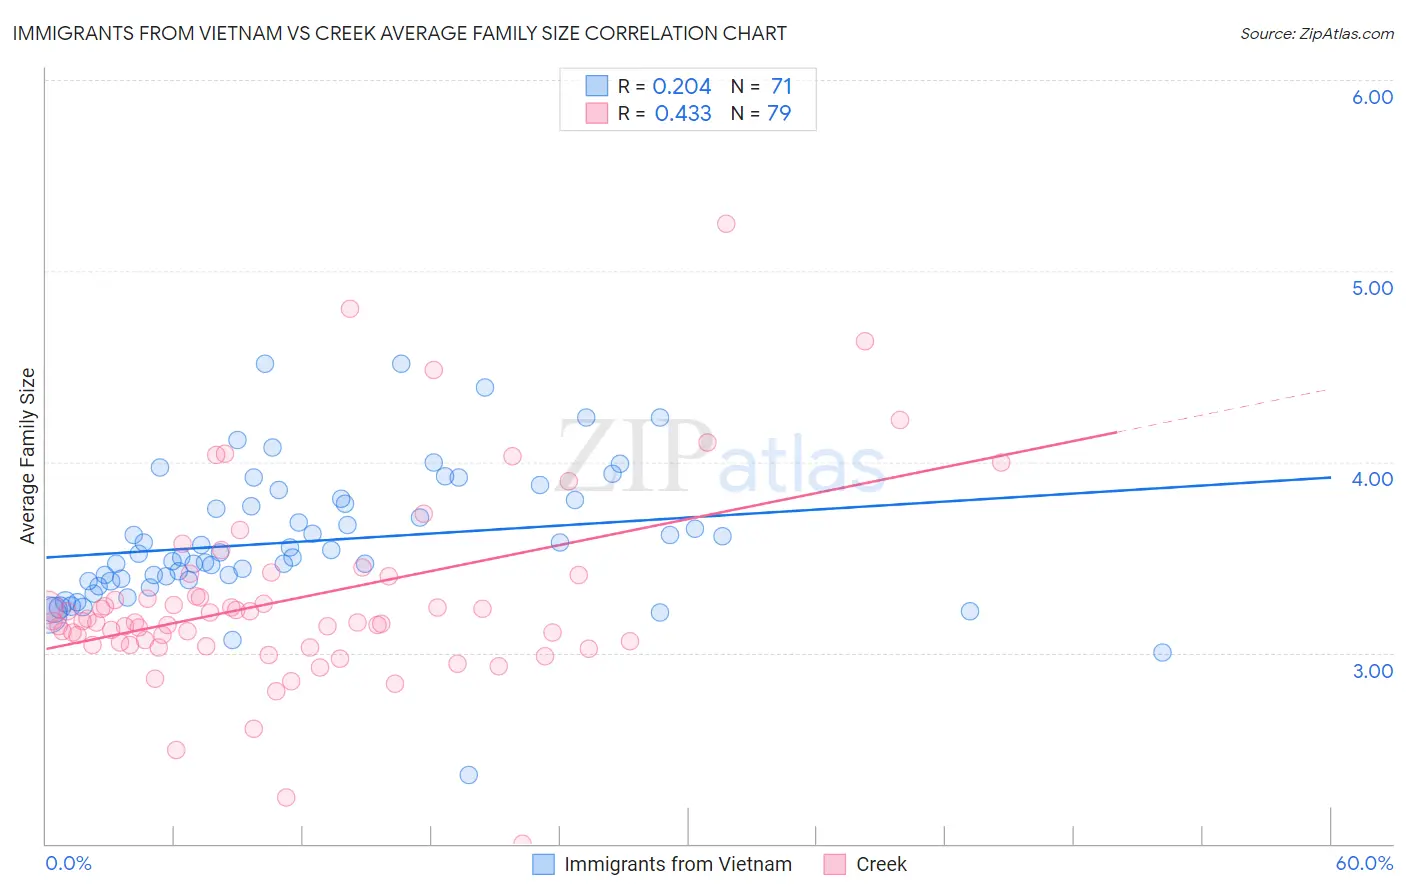
Immigrants from Vietnam vs Creek Average Family Size Correlation Chart
The statistical analysis conducted on geographies consisting of 404,558,006 people shows a weak positive correlation between the proportion of Immigrants from Vietnam and average family size in the United States with a correlation coefficient (R) of 0.204 and weighted average of 3.38. Similarly, the statistical analysis conducted on geographies consisting of 178,433,281 people shows a moderate positive correlation between the proportion of Creek and average family size in the United States with a correlation coefficient (R) of 0.433 and weighted average of 3.20, a difference of 5.6%.
Average Family Size Correlation Summary
| Measurement | Immigrants from Vietnam | Creek |
| Minimum | 2.36 | 2.00 |
| Maximum | 4.52 | 5.25 |
| Range | 2.16 | 3.25 |
| Mean | 3.58 | 3.29 |
| Median | 3.52 | 3.16 |
| Interquartile 25% (IQ1) | 3.38 | 3.04 |
| Interquartile 75% (IQ3) | 3.80 | 3.40 |
| Interquartile Range (IQR) | 0.42 | 0.36 |
| Standard Deviation (Sample) | 0.36 | 0.51 |
| Standard Deviation (Population) | 0.36 | 0.51 |
Similar Demographics by Average Family Size
Demographics Similar to Immigrants from Vietnam by Average Family Size
In terms of average family size, the demographic groups most similar to Immigrants from Vietnam are Marshallese (3.38, a difference of 0.060%), Immigrants from Philippines (3.37, a difference of 0.10%), Alaska Native (3.37, a difference of 0.11%), Shoshone (3.37, a difference of 0.14%), and Haitian (3.37, a difference of 0.20%).
| Demographics | Rating | Rank | Average Family Size |
| Guatemalans | 100.0 /100 | #35 | Exceptional 3.40 |
| Immigrants | Guyana | 100.0 /100 | #36 | Exceptional 3.40 |
| Guyanese | 100.0 /100 | #37 | Exceptional 3.40 |
| Immigrants | Belize | 100.0 /100 | #38 | Exceptional 3.39 |
| Immigrants | Haiti | 100.0 /100 | #39 | Exceptional 3.39 |
| Belizeans | 100.0 /100 | #40 | Exceptional 3.39 |
| Marshallese | 100.0 /100 | #41 | Exceptional 3.38 |
| Immigrants | Vietnam | 100.0 /100 | #42 | Exceptional 3.38 |
| Immigrants | Philippines | 100.0 /100 | #43 | Exceptional 3.37 |
| Alaska Natives | 100.0 /100 | #44 | Exceptional 3.37 |
| Shoshone | 100.0 /100 | #45 | Exceptional 3.37 |
| Haitians | 100.0 /100 | #46 | Exceptional 3.37 |
| Vietnamese | 100.0 /100 | #47 | Exceptional 3.37 |
| Immigrants | Nicaragua | 100.0 /100 | #48 | Exceptional 3.37 |
| Bangladeshis | 100.0 /100 | #49 | Exceptional 3.37 |
Demographics Similar to Creek by Average Family Size
In terms of average family size, the demographic groups most similar to Creek are Immigrants from Iran (3.20, a difference of 0.0%), Zimbabwean (3.20, a difference of 0.020%), Mongolian (3.20, a difference of 0.020%), Somali (3.20, a difference of 0.040%), and Chippewa (3.20, a difference of 0.050%).
| Demographics | Rating | Rank | Average Family Size |
| Paraguayans | 16.3 /100 | #205 | Poor 3.20 |
| Immigrants | Cabo Verde | 16.0 /100 | #206 | Poor 3.20 |
| Filipinos | 13.6 /100 | #207 | Poor 3.20 |
| Chippewa | 13.3 /100 | #208 | Poor 3.20 |
| Sudanese | 13.3 /100 | #209 | Poor 3.20 |
| Zimbabweans | 12.6 /100 | #210 | Poor 3.20 |
| Immigrants | Iran | 12.1 /100 | #211 | Poor 3.20 |
| Creek | 12.1 /100 | #212 | Poor 3.20 |
| Mongolians | 11.5 /100 | #213 | Poor 3.20 |
| Somalis | 11.2 /100 | #214 | Poor 3.20 |
| Delaware | 11.1 /100 | #215 | Poor 3.20 |
| Bermudans | 11.0 /100 | #216 | Poor 3.20 |
| Immigrants | Somalia | 10.3 /100 | #217 | Poor 3.20 |
| French American Indians | 9.8 /100 | #218 | Tragic 3.20 |
| Pennsylvania Germans | 9.3 /100 | #219 | Tragic 3.19 |