Immigrants from Liberia vs Tsimshian Births to Unmarried Women
COMPARE
Immigrants from Liberia
Tsimshian
Births to Unmarried Women
Births to Unmarried Women Comparison
Immigrants from Liberia
Tsimshian
37.6%
BIRTHS TO UNMARRIED WOMEN
0.0/ 100
METRIC RATING
288th/ 347
METRIC RANK
42.2%
BIRTHS TO UNMARRIED WOMEN
0.0/ 100
METRIC RATING
327th/ 347
METRIC RANK
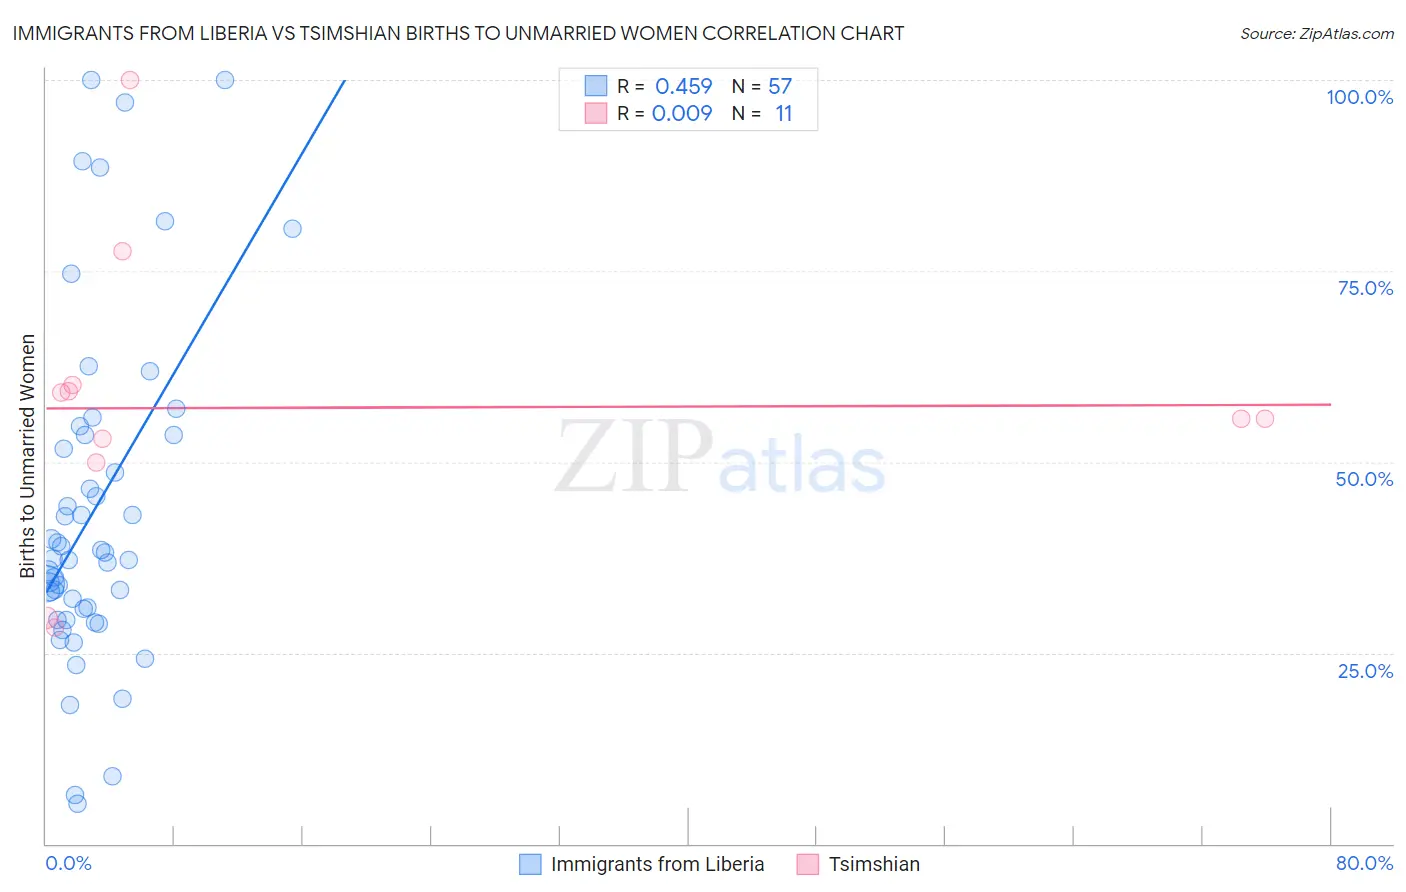
Immigrants from Liberia vs Tsimshian Births to Unmarried Women Correlation Chart
The statistical analysis conducted on geographies consisting of 132,597,891 people shows a moderate positive correlation between the proportion of Immigrants from Liberia and percentage of births to unmarried women in the United States with a correlation coefficient (R) of 0.459 and weighted average of 37.6%. Similarly, the statistical analysis conducted on geographies consisting of 15,351,381 people shows no correlation between the proportion of Tsimshian and percentage of births to unmarried women in the United States with a correlation coefficient (R) of 0.009 and weighted average of 42.2%, a difference of 12.0%.
Births to Unmarried Women Correlation Summary
| Measurement | Immigrants from Liberia | Tsimshian |
| Minimum | 5.3% | 28.3% |
| Maximum | 100.0% | 100.0% |
| Range | 94.7% | 71.7% |
| Mean | 43.7% | 57.1% |
| Median | 37.4% | 55.6% |
| Interquartile 25% (IQ1) | 30.1% | 50.0% |
| Interquartile 75% (IQ3) | 53.5% | 60.0% |
| Interquartile Range (IQR) | 23.4% | 10.0% |
| Standard Deviation (Sample) | 22.3% | 19.8% |
| Standard Deviation (Population) | 22.1% | 18.9% |
Similar Demographics by Births to Unmarried Women
Demographics Similar to Immigrants from Liberia by Births to Unmarried Women
In terms of births to unmarried women, the demographic groups most similar to Immigrants from Liberia are Creek (37.6%, a difference of 0.17%), Alaskan Athabascan (37.7%, a difference of 0.23%), Hispanic or Latino (37.8%, a difference of 0.37%), Immigrants from Guatemala (37.5%, a difference of 0.40%), and Immigrants from Mexico (37.5%, a difference of 0.41%).
| Demographics | Rating | Rank | Births to Unmarried Women |
| Immigrants | Belize | 0.1 /100 | #281 | Tragic 37.3% |
| Liberians | 0.0 /100 | #282 | Tragic 37.4% |
| Spanish American Indians | 0.0 /100 | #283 | Tragic 37.4% |
| Immigrants | Central America | 0.0 /100 | #284 | Tragic 37.4% |
| Immigrants | Mexico | 0.0 /100 | #285 | Tragic 37.5% |
| Immigrants | Guatemala | 0.0 /100 | #286 | Tragic 37.5% |
| Creek | 0.0 /100 | #287 | Tragic 37.6% |
| Immigrants | Liberia | 0.0 /100 | #288 | Tragic 37.6% |
| Alaskan Athabascans | 0.0 /100 | #289 | Tragic 37.7% |
| Hispanics or Latinos | 0.0 /100 | #290 | Tragic 37.8% |
| Seminole | 0.0 /100 | #291 | Tragic 37.9% |
| Blackfeet | 0.0 /100 | #292 | Tragic 37.9% |
| Immigrants | Nicaragua | 0.0 /100 | #293 | Tragic 38.0% |
| British West Indians | 0.0 /100 | #294 | Tragic 38.0% |
| Iroquois | 0.0 /100 | #295 | Tragic 38.2% |
Demographics Similar to Tsimshian by Births to Unmarried Women
In terms of births to unmarried women, the demographic groups most similar to Tsimshian are Immigrants from Cabo Verde (42.2%, a difference of 0.13%), Paiute (42.5%, a difference of 0.74%), Chippewa (42.6%, a difference of 1.1%), Immigrants from Cuba (41.5%, a difference of 1.7%), and Cheyenne (41.3%, a difference of 1.9%).
| Demographics | Rating | Rank | Births to Unmarried Women |
| Crow | 0.0 /100 | #320 | Tragic 40.4% |
| Bahamians | 0.0 /100 | #321 | Tragic 40.8% |
| Cajuns | 0.0 /100 | #322 | Tragic 41.0% |
| Sioux | 0.0 /100 | #323 | Tragic 41.0% |
| Cape Verdeans | 0.0 /100 | #324 | Tragic 41.3% |
| Cheyenne | 0.0 /100 | #325 | Tragic 41.3% |
| Immigrants | Cuba | 0.0 /100 | #326 | Tragic 41.5% |
| Tsimshian | 0.0 /100 | #327 | Tragic 42.2% |
| Immigrants | Cabo Verde | 0.0 /100 | #328 | Tragic 42.2% |
| Paiute | 0.0 /100 | #329 | Tragic 42.5% |
| Chippewa | 0.0 /100 | #330 | Tragic 42.6% |
| Natives/Alaskans | 0.0 /100 | #331 | Tragic 43.0% |
| Kiowa | 0.0 /100 | #332 | Tragic 43.1% |
| Blacks/African Americans | 0.0 /100 | #333 | Tragic 44.3% |
| Yuman | 0.0 /100 | #334 | Tragic 44.4% |