Immigrants from Latin America vs Immigrants from Afghanistan Average Family Size
COMPARE
Immigrants from Latin America
Immigrants from Afghanistan
Average Family Size
Average Family Size Comparison
Immigrants from Latin America
Immigrants from Afghanistan
3.42
AVERAGE FAMILY SIZE
100.0/ 100
METRIC RATING
28th/ 347
METRIC RANK
3.32
AVERAGE FAMILY SIZE
99.8/ 100
METRIC RATING
83rd/ 347
METRIC RANK
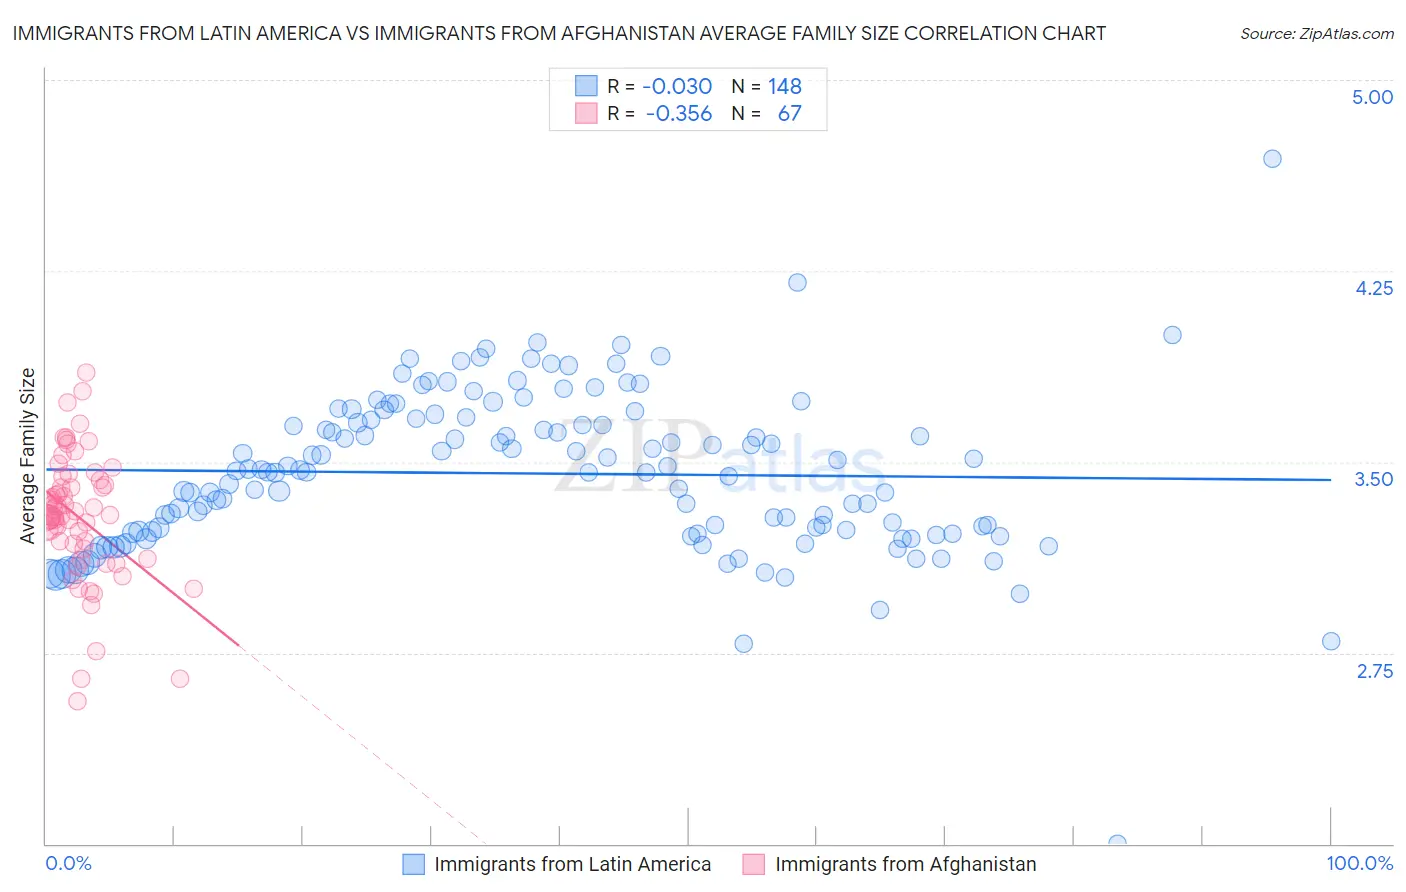
Immigrants from Latin America vs Immigrants from Afghanistan Average Family Size Correlation Chart
The statistical analysis conducted on geographies consisting of 558,036,591 people shows no correlation between the proportion of Immigrants from Latin America and average family size in the United States with a correlation coefficient (R) of -0.030 and weighted average of 3.42. Similarly, the statistical analysis conducted on geographies consisting of 147,621,409 people shows a mild negative correlation between the proportion of Immigrants from Afghanistan and average family size in the United States with a correlation coefficient (R) of -0.356 and weighted average of 3.32, a difference of 3.2%.
Average Family Size Correlation Summary
| Measurement | Immigrants from Latin America | Immigrants from Afghanistan |
| Minimum | 2.00 | 2.56 |
| Maximum | 4.69 | 3.85 |
| Range | 2.69 | 1.29 |
| Mean | 3.45 | 3.28 |
| Median | 3.46 | 3.29 |
| Interquartile 25% (IQ1) | 3.22 | 3.16 |
| Interquartile 75% (IQ3) | 3.67 | 3.43 |
| Interquartile Range (IQR) | 0.45 | 0.27 |
| Standard Deviation (Sample) | 0.32 | 0.25 |
| Standard Deviation (Population) | 0.32 | 0.25 |
Similar Demographics by Average Family Size
Demographics Similar to Immigrants from Latin America by Average Family Size
In terms of average family size, the demographic groups most similar to Immigrants from Latin America are Nepalese (3.42, a difference of 0.090%), Mexican American Indian (3.43, a difference of 0.12%), Samoan (3.42, a difference of 0.12%), Native Hawaiian (3.43, a difference of 0.13%), and Central American (3.41, a difference of 0.32%).
| Demographics | Rating | Rank | Average Family Size |
| Yuman | 100.0 /100 | #21 | Exceptional 3.47 |
| Apache | 100.0 /100 | #22 | Exceptional 3.46 |
| Immigrants | Fiji | 100.0 /100 | #23 | Exceptional 3.45 |
| Natives/Alaskans | 100.0 /100 | #24 | Exceptional 3.45 |
| Yakama | 100.0 /100 | #25 | Exceptional 3.45 |
| Native Hawaiians | 100.0 /100 | #26 | Exceptional 3.43 |
| Mexican American Indians | 100.0 /100 | #27 | Exceptional 3.43 |
| Immigrants | Latin America | 100.0 /100 | #28 | Exceptional 3.42 |
| Nepalese | 100.0 /100 | #29 | Exceptional 3.42 |
| Samoans | 100.0 /100 | #30 | Exceptional 3.42 |
| Central Americans | 100.0 /100 | #31 | Exceptional 3.41 |
| Immigrants | Guatemala | 100.0 /100 | #32 | Exceptional 3.41 |
| Hawaiians | 100.0 /100 | #33 | Exceptional 3.41 |
| Hispanics or Latinos | 100.0 /100 | #34 | Exceptional 3.41 |
| Guatemalans | 100.0 /100 | #35 | Exceptional 3.40 |
Demographics Similar to Immigrants from Afghanistan by Average Family Size
In terms of average family size, the demographic groups most similar to Immigrants from Afghanistan are Ecuadorian (3.32, a difference of 0.010%), Immigrants from Nigeria (3.32, a difference of 0.030%), Immigrants from Dominica (3.32, a difference of 0.050%), Afghan (3.31, a difference of 0.080%), and Lumbee (3.32, a difference of 0.090%).
| Demographics | Rating | Rank | Average Family Size |
| Trinidadians and Tobagonians | 99.8 /100 | #76 | Exceptional 3.32 |
| Immigrants | Ecuador | 99.8 /100 | #77 | Exceptional 3.32 |
| Immigrants | Micronesia | 99.8 /100 | #78 | Exceptional 3.32 |
| British West Indians | 99.8 /100 | #79 | Exceptional 3.32 |
| Lumbee | 99.8 /100 | #80 | Exceptional 3.32 |
| Immigrants | Dominica | 99.8 /100 | #81 | Exceptional 3.32 |
| Ecuadorians | 99.8 /100 | #82 | Exceptional 3.32 |
| Immigrants | Afghanistan | 99.8 /100 | #83 | Exceptional 3.32 |
| Immigrants | Nigeria | 99.7 /100 | #84 | Exceptional 3.32 |
| Afghans | 99.7 /100 | #85 | Exceptional 3.31 |
| Jamaicans | 99.7 /100 | #86 | Exceptional 3.31 |
| Immigrants | Peru | 99.7 /100 | #87 | Exceptional 3.31 |
| Immigrants | Bolivia | 99.6 /100 | #88 | Exceptional 3.31 |
| Malaysians | 99.6 /100 | #89 | Exceptional 3.31 |
| Menominee | 99.4 /100 | #90 | Exceptional 3.30 |