Immigrants from Moldova vs Belizean Family Households with Children
COMPARE
Immigrants from Moldova
Belizean
Family Households with Children
Family Households with Children Comparison
Immigrants from Moldova
Belizeans
27.6%
FAMILY HOUSEHOLDS WITH CHILDREN
79.1/ 100
METRIC RATING
147th/ 347
METRIC RANK
27.8%
FAMILY HOUSEHOLDS WITH CHILDREN
90.0/ 100
METRIC RATING
127th/ 347
METRIC RANK
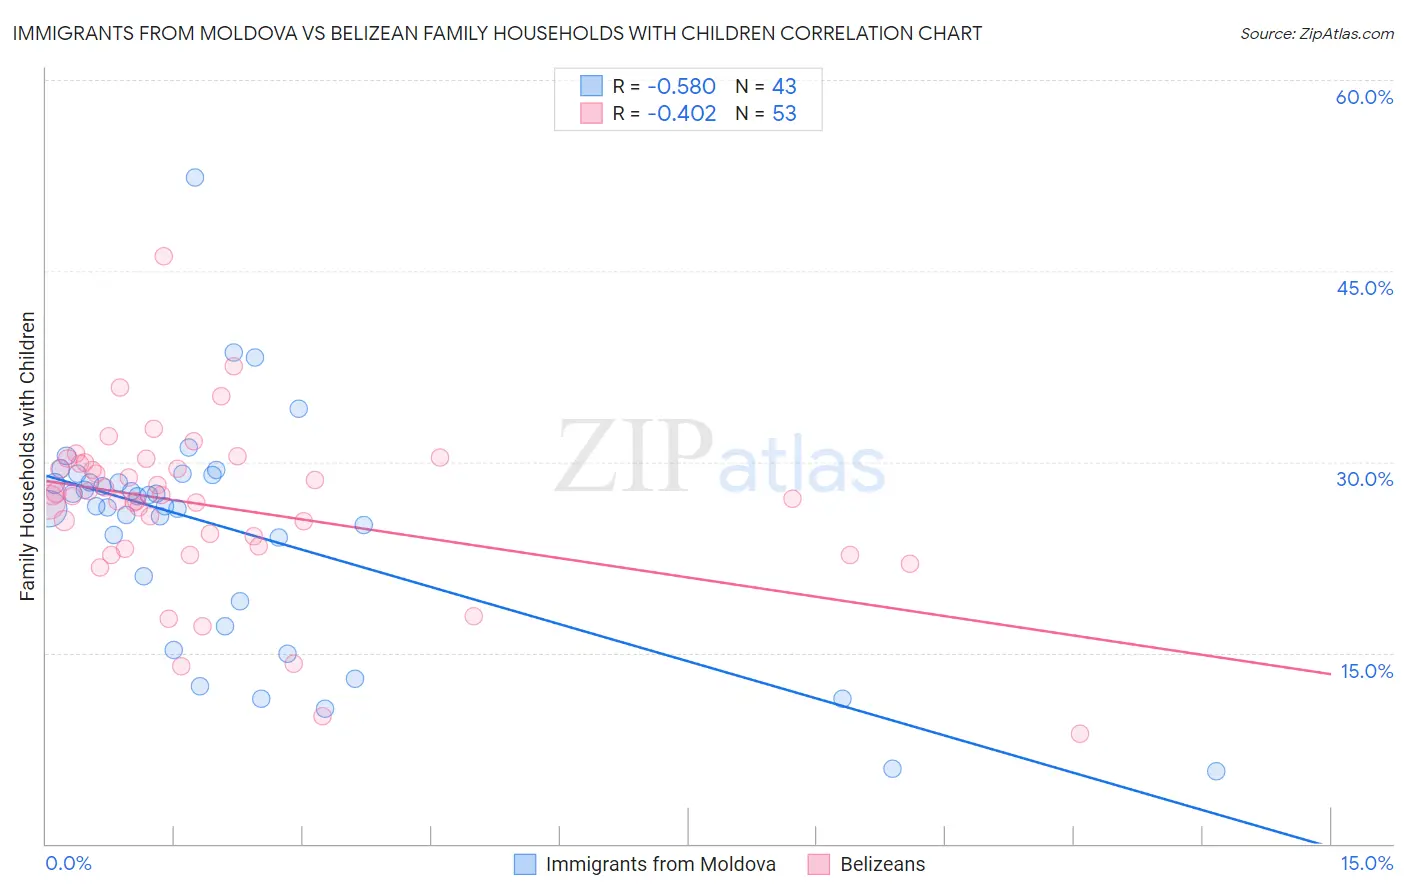
Immigrants from Moldova vs Belizean Family Households with Children Correlation Chart
The statistical analysis conducted on geographies consisting of 124,355,422 people shows a substantial negative correlation between the proportion of Immigrants from Moldova and percentage of family households with children in the United States with a correlation coefficient (R) of -0.580 and weighted average of 27.6%. Similarly, the statistical analysis conducted on geographies consisting of 144,146,110 people shows a moderate negative correlation between the proportion of Belizeans and percentage of family households with children in the United States with a correlation coefficient (R) of -0.402 and weighted average of 27.8%, a difference of 0.48%.
Family Households with Children Correlation Summary
| Measurement | Immigrants from Moldova | Belizean |
| Minimum | 5.6% | 8.6% |
| Maximum | 52.3% | 46.2% |
| Range | 46.7% | 37.6% |
| Mean | 24.7% | 26.4% |
| Median | 26.6% | 27.3% |
| Interquartile 25% (IQ1) | 19.1% | 23.3% |
| Interquartile 75% (IQ3) | 29.0% | 29.9% |
| Interquartile Range (IQR) | 9.9% | 6.6% |
| Standard Deviation (Sample) | 9.0% | 6.5% |
| Standard Deviation (Population) | 8.9% | 6.4% |
Demographics Similar to Immigrants from Moldova and Belizeans by Family Households with Children
In terms of family households with children, the demographic groups most similar to Immigrants from Moldova are Immigrants from Chile (27.7%, a difference of 0.010%), Basque (27.7%, a difference of 0.010%), Brazilian (27.7%, a difference of 0.020%), Immigrants from Eastern Africa (27.7%, a difference of 0.040%), and Swiss (27.7%, a difference of 0.080%). Similarly, the demographic groups most similar to Belizeans are Syrian (27.8%, a difference of 0.020%), Immigrants from Eritrea (27.8%, a difference of 0.040%), Cajun (27.7%, a difference of 0.13%), Lebanese (27.7%, a difference of 0.14%), and Immigrants from Belize (27.7%, a difference of 0.22%).
| Demographics | Rating | Rank | Family Households with Children |
| Belizeans | 90.0 /100 | #127 | Exceptional 27.8% |
| Syrians | 89.7 /100 | #128 | Excellent 27.8% |
| Immigrants | Eritrea | 89.4 /100 | #129 | Excellent 27.8% |
| Cajuns | 87.6 /100 | #130 | Excellent 27.7% |
| Lebanese | 87.4 /100 | #131 | Excellent 27.7% |
| Immigrants | Belize | 85.7 /100 | #132 | Excellent 27.7% |
| Iranians | 85.2 /100 | #133 | Excellent 27.7% |
| Immigrants | Panama | 84.9 /100 | #134 | Excellent 27.7% |
| Immigrants | Ecuador | 84.6 /100 | #135 | Excellent 27.7% |
| Immigrants | Portugal | 84.1 /100 | #136 | Excellent 27.7% |
| Immigrants | Dominican Republic | 83.9 /100 | #137 | Excellent 27.7% |
| Uruguayans | 83.2 /100 | #138 | Excellent 27.7% |
| Vietnamese | 82.6 /100 | #139 | Excellent 27.7% |
| Spanish | 81.8 /100 | #140 | Excellent 27.7% |
| Immigrants | Eastern Asia | 81.7 /100 | #141 | Excellent 27.7% |
| Swiss | 81.4 /100 | #142 | Excellent 27.7% |
| Immigrants | Eastern Africa | 80.2 /100 | #143 | Excellent 27.7% |
| Brazilians | 79.6 /100 | #144 | Good 27.7% |
| Immigrants | Chile | 79.5 /100 | #145 | Good 27.7% |
| Basques | 79.5 /100 | #146 | Good 27.7% |
| Immigrants | Moldova | 79.1 /100 | #147 | Good 27.6% |