Immigrants from Kazakhstan vs Belizean Family Households with Children
COMPARE
Immigrants from Kazakhstan
Belizean
Family Households with Children
Family Households with Children Comparison
Immigrants from Kazakhstan
Belizeans
26.9%
FAMILY HOUSEHOLDS WITH CHILDREN
2.2/ 100
METRIC RATING
248th/ 347
METRIC RANK
27.8%
FAMILY HOUSEHOLDS WITH CHILDREN
90.0/ 100
METRIC RATING
127th/ 347
METRIC RANK
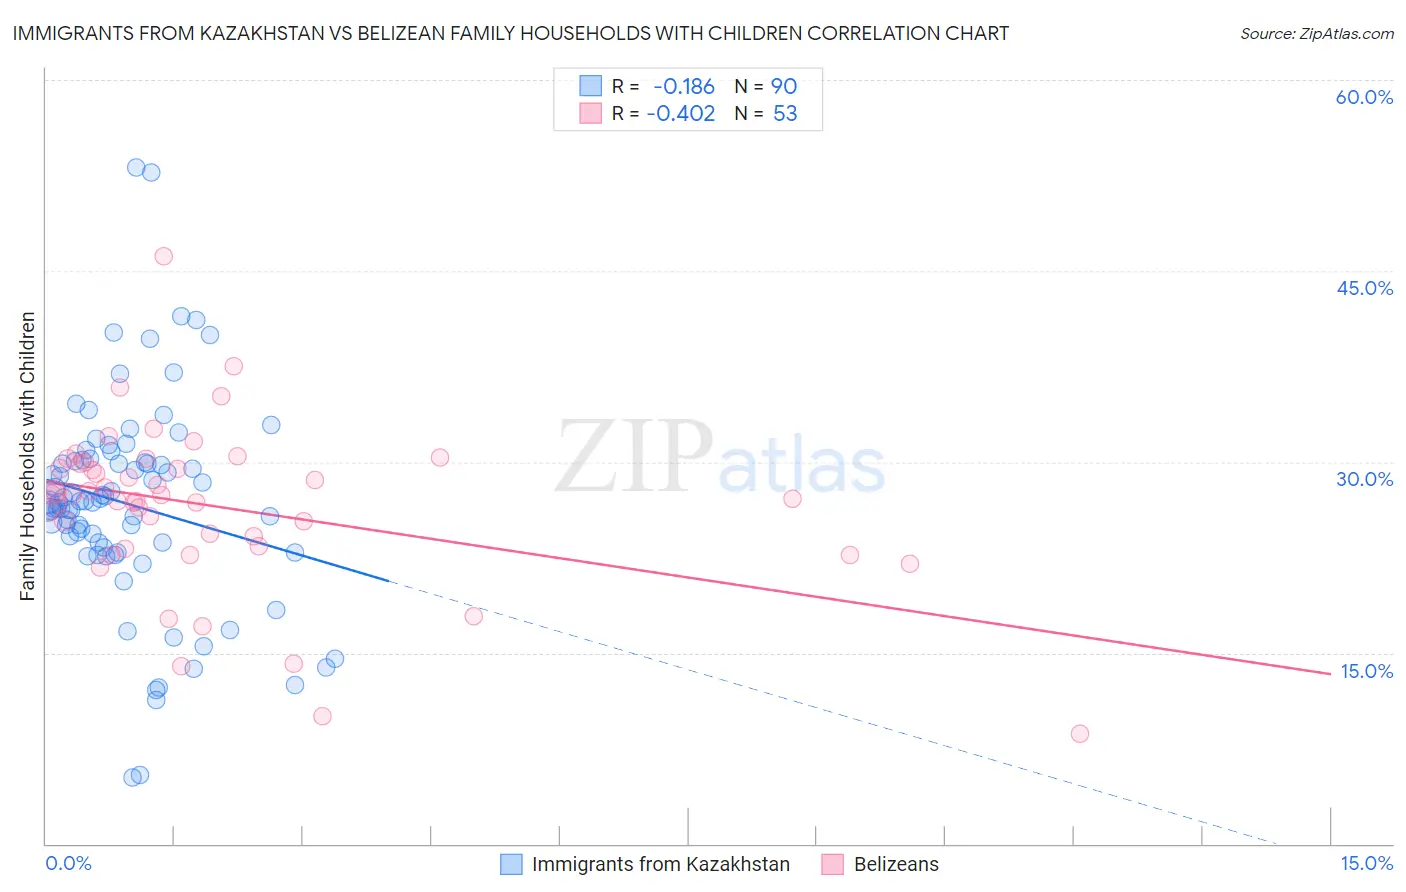
Immigrants from Kazakhstan vs Belizean Family Households with Children Correlation Chart
The statistical analysis conducted on geographies consisting of 124,425,181 people shows a poor negative correlation between the proportion of Immigrants from Kazakhstan and percentage of family households with children in the United States with a correlation coefficient (R) of -0.186 and weighted average of 26.9%. Similarly, the statistical analysis conducted on geographies consisting of 144,146,110 people shows a moderate negative correlation between the proportion of Belizeans and percentage of family households with children in the United States with a correlation coefficient (R) of -0.402 and weighted average of 27.8%, a difference of 3.4%.
Family Households with Children Correlation Summary
| Measurement | Immigrants from Kazakhstan | Belizean |
| Minimum | 5.2% | 8.6% |
| Maximum | 53.2% | 46.2% |
| Range | 48.0% | 37.6% |
| Mean | 26.7% | 26.4% |
| Median | 26.8% | 27.3% |
| Interquartile 25% (IQ1) | 23.3% | 23.3% |
| Interquartile 75% (IQ3) | 30.0% | 29.9% |
| Interquartile Range (IQR) | 6.7% | 6.6% |
| Standard Deviation (Sample) | 8.2% | 6.5% |
| Standard Deviation (Population) | 8.2% | 6.4% |
Similar Demographics by Family Households with Children
Demographics Similar to Immigrants from Kazakhstan by Family Households with Children
In terms of family households with children, the demographic groups most similar to Immigrants from Kazakhstan are Potawatomi (26.9%, a difference of 0.010%), Immigrants from Eastern Europe (26.9%, a difference of 0.020%), Belgian (26.9%, a difference of 0.020%), Jamaican (26.9%, a difference of 0.070%), and Immigrants from Bosnia and Herzegovina (26.8%, a difference of 0.080%).
| Demographics | Rating | Rank | Family Households with Children |
| Navajo | 3.2 /100 | #241 | Tragic 26.9% |
| Immigrants | England | 3.2 /100 | #242 | Tragic 26.9% |
| Immigrants | Saudi Arabia | 2.9 /100 | #243 | Tragic 26.9% |
| Ukrainians | 2.9 /100 | #244 | Tragic 26.9% |
| Australians | 2.8 /100 | #245 | Tragic 26.9% |
| Jamaicans | 2.5 /100 | #246 | Tragic 26.9% |
| Potawatomi | 2.2 /100 | #247 | Tragic 26.9% |
| Immigrants | Kazakhstan | 2.2 /100 | #248 | Tragic 26.9% |
| Immigrants | Eastern Europe | 2.1 /100 | #249 | Tragic 26.9% |
| Belgians | 2.1 /100 | #250 | Tragic 26.9% |
| Immigrants | Bosnia and Herzegovina | 1.9 /100 | #251 | Tragic 26.8% |
| Irish | 1.8 /100 | #252 | Tragic 26.8% |
| Italians | 1.5 /100 | #253 | Tragic 26.8% |
| Immigrants | Scotland | 1.5 /100 | #254 | Tragic 26.8% |
| German Russians | 1.5 /100 | #255 | Tragic 26.8% |
Demographics Similar to Belizeans by Family Households with Children
In terms of family households with children, the demographic groups most similar to Belizeans are Syrian (27.8%, a difference of 0.020%), Immigrants from Ethiopia (27.8%, a difference of 0.030%), Immigrants from Eritrea (27.8%, a difference of 0.040%), Immigrants from Singapore (27.8%, a difference of 0.050%), and Ecuadorian (27.8%, a difference of 0.050%).
| Demographics | Rating | Rank | Family Households with Children |
| Europeans | 95.4 /100 | #120 | Exceptional 27.9% |
| Immigrants | Western Asia | 93.6 /100 | #121 | Exceptional 27.9% |
| Immigrants | Zimbabwe | 92.8 /100 | #122 | Exceptional 27.8% |
| Immigrants | Northern Africa | 91.8 /100 | #123 | Exceptional 27.8% |
| Immigrants | Singapore | 90.8 /100 | #124 | Exceptional 27.8% |
| Ecuadorians | 90.8 /100 | #125 | Exceptional 27.8% |
| Immigrants | Ethiopia | 90.5 /100 | #126 | Exceptional 27.8% |
| Belizeans | 90.0 /100 | #127 | Exceptional 27.8% |
| Syrians | 89.7 /100 | #128 | Excellent 27.8% |
| Immigrants | Eritrea | 89.4 /100 | #129 | Excellent 27.8% |
| Cajuns | 87.6 /100 | #130 | Excellent 27.7% |
| Lebanese | 87.4 /100 | #131 | Excellent 27.7% |
| Immigrants | Belize | 85.7 /100 | #132 | Excellent 27.7% |
| Iranians | 85.2 /100 | #133 | Excellent 27.7% |
| Immigrants | Panama | 84.9 /100 | #134 | Excellent 27.7% |