Nicaraguan vs Arab 10th Grade
COMPARE
Nicaraguan
Arab
10th Grade
10th Grade Comparison
Nicaraguans
Arabs
90.2%
10TH GRADE
0.0/ 100
METRIC RATING
319th/ 347
METRIC RANK
94.0%
10TH GRADE
80.9/ 100
METRIC RATING
148th/ 347
METRIC RANK
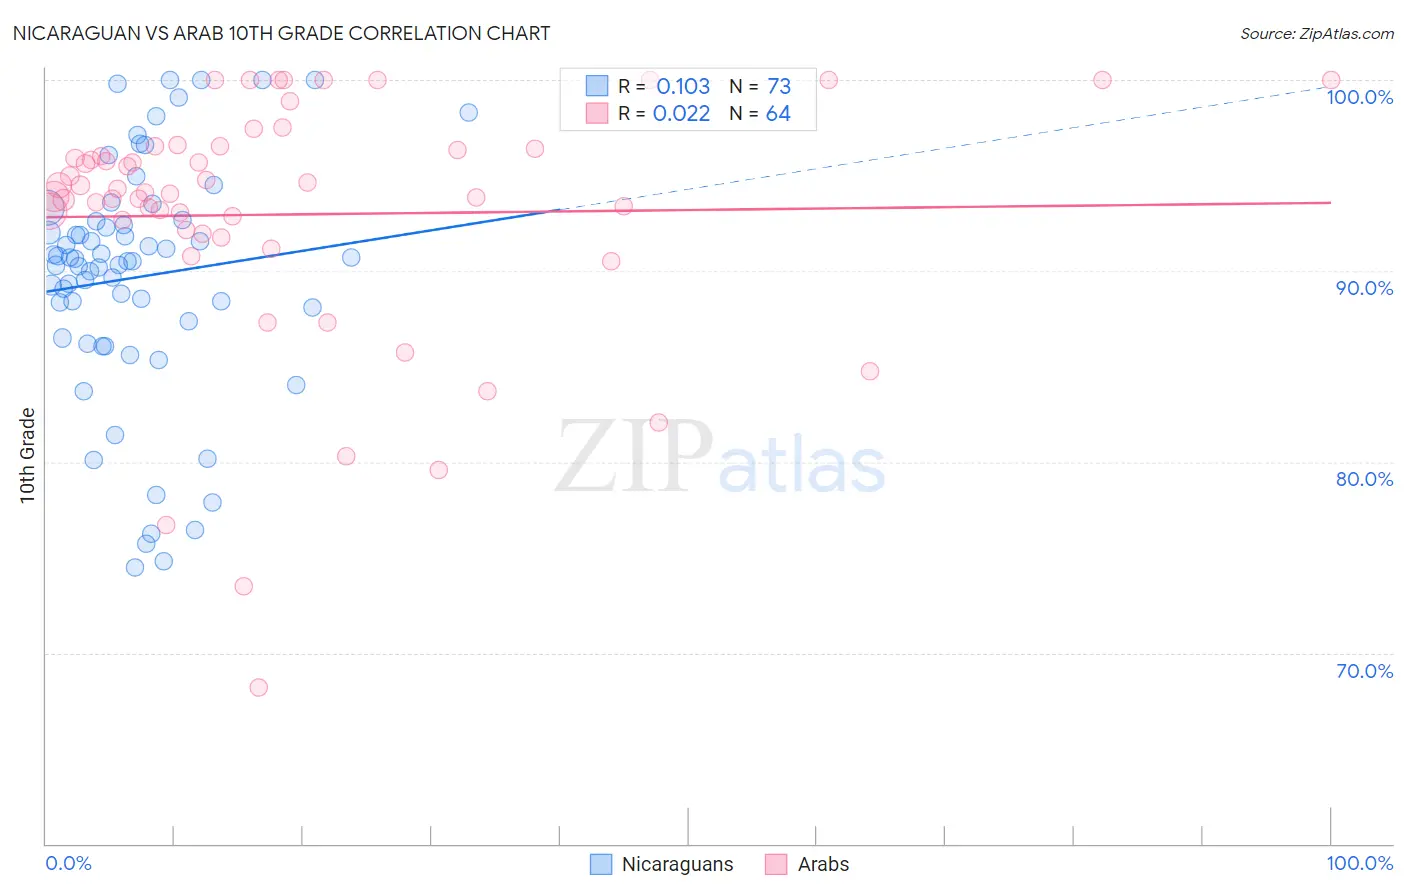
Nicaraguan vs Arab 10th Grade Correlation Chart
The statistical analysis conducted on geographies consisting of 285,711,651 people shows a poor positive correlation between the proportion of Nicaraguans and percentage of population with at least 10th grade education in the United States with a correlation coefficient (R) of 0.103 and weighted average of 90.2%. Similarly, the statistical analysis conducted on geographies consisting of 486,870,847 people shows no correlation between the proportion of Arabs and percentage of population with at least 10th grade education in the United States with a correlation coefficient (R) of 0.022 and weighted average of 94.0%, a difference of 4.3%.
10th Grade Correlation Summary
| Measurement | Nicaraguan | Arab |
| Minimum | 74.5% | 68.2% |
| Maximum | 100.0% | 100.0% |
| Range | 25.5% | 31.8% |
| Mean | 89.7% | 93.0% |
| Median | 90.5% | 94.2% |
| Interquartile 25% (IQ1) | 86.9% | 92.0% |
| Interquartile 75% (IQ3) | 92.6% | 96.5% |
| Interquartile Range (IQR) | 5.7% | 4.4% |
| Standard Deviation (Sample) | 6.3% | 6.6% |
| Standard Deviation (Population) | 6.2% | 6.5% |
Similar Demographics by 10th Grade
Demographics Similar to Nicaraguans by 10th Grade
In terms of 10th grade, the demographic groups most similar to Nicaraguans are Houma (90.2%, a difference of 0.010%), Belizean (90.2%, a difference of 0.010%), Tohono O'odham (90.1%, a difference of 0.020%), Immigrants from Cuba (90.2%, a difference of 0.080%), and Immigrants from Belize (90.1%, a difference of 0.11%).
| Demographics | Rating | Rank | 10th Grade |
| Immigrants | Portugal | 0.0 /100 | #312 | Tragic 90.8% |
| Cape Verdeans | 0.0 /100 | #313 | Tragic 90.8% |
| Nepalese | 0.0 /100 | #314 | Tragic 90.7% |
| Immigrants | Caribbean | 0.0 /100 | #315 | Tragic 90.6% |
| Ecuadorians | 0.0 /100 | #316 | Tragic 90.6% |
| Immigrants | Ecuador | 0.0 /100 | #317 | Tragic 90.4% |
| Immigrants | Cuba | 0.0 /100 | #318 | Tragic 90.2% |
| Nicaraguans | 0.0 /100 | #319 | Tragic 90.2% |
| Houma | 0.0 /100 | #320 | Tragic 90.2% |
| Belizeans | 0.0 /100 | #321 | Tragic 90.2% |
| Tohono O'odham | 0.0 /100 | #322 | Tragic 90.1% |
| Immigrants | Belize | 0.0 /100 | #323 | Tragic 90.1% |
| Immigrants | Armenia | 0.0 /100 | #324 | Tragic 89.9% |
| Puerto Ricans | 0.0 /100 | #325 | Tragic 89.8% |
| Central American Indians | 0.0 /100 | #326 | Tragic 89.7% |
Demographics Similar to Arabs by 10th Grade
In terms of 10th grade, the demographic groups most similar to Arabs are Ugandan (94.0%, a difference of 0.0%), Immigrants from Ukraine (94.0%, a difference of 0.010%), Chickasaw (94.1%, a difference of 0.020%), Egyptian (94.0%, a difference of 0.020%), and Kenyan (94.0%, a difference of 0.030%).
| Demographics | Rating | Rank | 10th Grade |
| Hmong | 86.6 /100 | #141 | Excellent 94.1% |
| Albanians | 86.5 /100 | #142 | Excellent 94.1% |
| Cherokee | 84.9 /100 | #143 | Excellent 94.1% |
| Immigrants | Kazakhstan | 84.9 /100 | #144 | Excellent 94.1% |
| Immigrants | Nonimmigrants | 83.8 /100 | #145 | Excellent 94.1% |
| Chickasaw | 82.6 /100 | #146 | Excellent 94.1% |
| Immigrants | Ukraine | 81.5 /100 | #147 | Excellent 94.0% |
| Arabs | 80.9 /100 | #148 | Excellent 94.0% |
| Ugandans | 80.7 /100 | #149 | Excellent 94.0% |
| Egyptians | 79.6 /100 | #150 | Good 94.0% |
| Kenyans | 79.1 /100 | #151 | Good 94.0% |
| Immigrants | Italy | 78.0 /100 | #152 | Good 94.0% |
| Immigrants | Brazil | 75.5 /100 | #153 | Good 94.0% |
| Immigrants | Kenya | 75.3 /100 | #154 | Good 94.0% |
| Spanish | 74.9 /100 | #155 | Good 94.0% |