Nepalese vs Immigrants from Panama Associate's Degree
COMPARE
Nepalese
Immigrants from Panama
Associate's Degree
Associate's Degree Comparison
Nepalese
Immigrants from Panama
39.0%
ASSOCIATE'S DEGREE
0.0/ 100
METRIC RATING
293rd/ 347
METRIC RANK
44.7%
ASSOCIATE'S DEGREE
12.4/ 100
METRIC RATING
215th/ 347
METRIC RANK
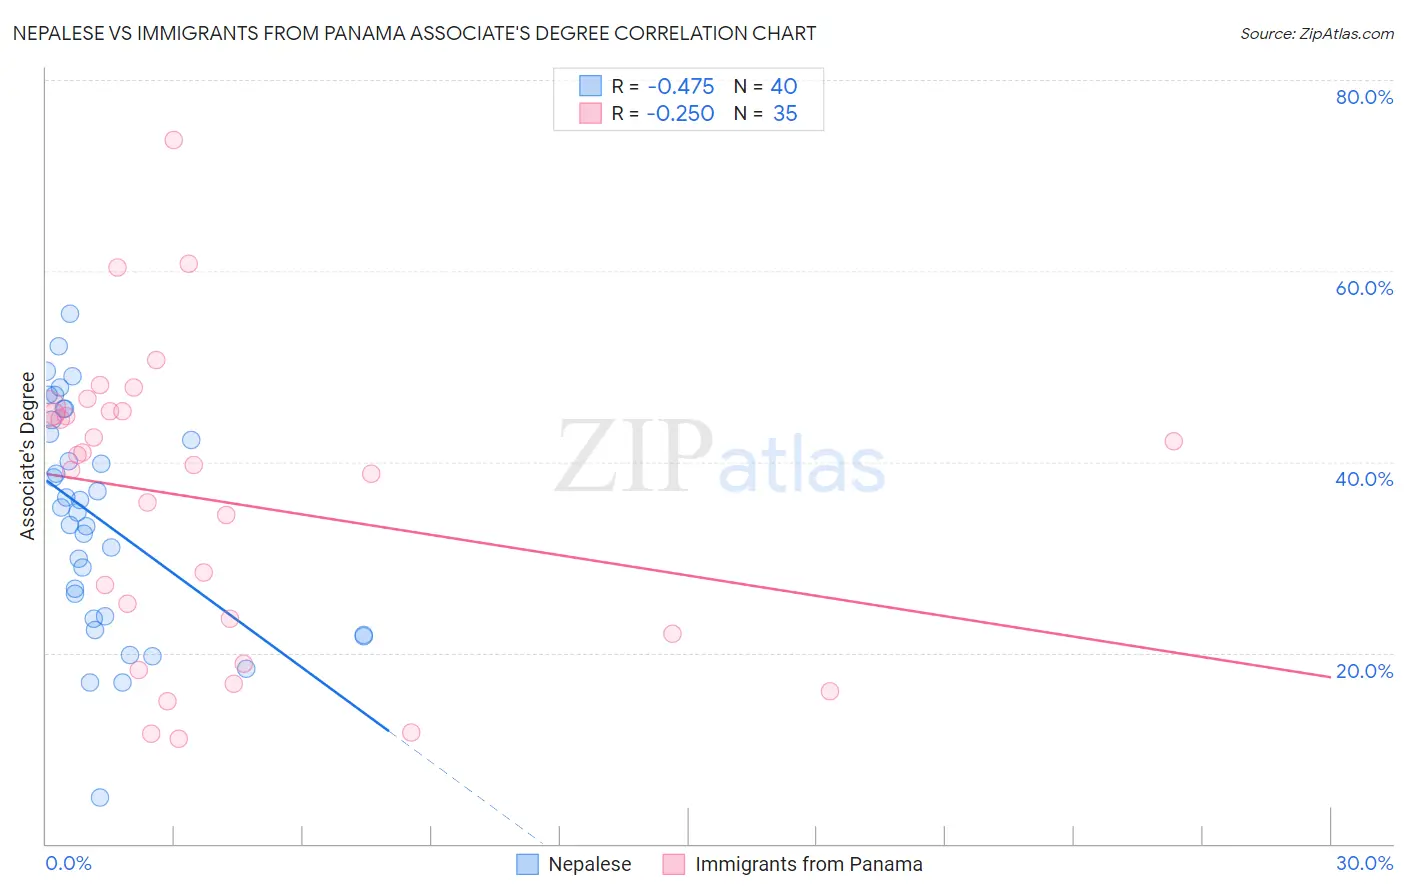
Nepalese vs Immigrants from Panama Associate's Degree Correlation Chart
The statistical analysis conducted on geographies consisting of 24,521,755 people shows a moderate negative correlation between the proportion of Nepalese and percentage of population with at least associate's degree education in the United States with a correlation coefficient (R) of -0.475 and weighted average of 39.0%. Similarly, the statistical analysis conducted on geographies consisting of 221,180,588 people shows a weak negative correlation between the proportion of Immigrants from Panama and percentage of population with at least associate's degree education in the United States with a correlation coefficient (R) of -0.250 and weighted average of 44.7%, a difference of 14.4%.
Associate's Degree Correlation Summary
| Measurement | Nepalese | Immigrants from Panama |
| Minimum | 4.8% | 11.1% |
| Maximum | 55.5% | 73.8% |
| Range | 50.8% | 62.7% |
| Mean | 33.9% | 35.9% |
| Median | 35.0% | 39.6% |
| Interquartile 25% (IQ1) | 23.7% | 22.0% |
| Interquartile 75% (IQ3) | 43.7% | 45.4% |
| Interquartile Range (IQR) | 20.0% | 23.4% |
| Standard Deviation (Sample) | 11.7% | 15.5% |
| Standard Deviation (Population) | 11.6% | 15.3% |
Similar Demographics by Associate's Degree
Demographics Similar to Nepalese by Associate's Degree
In terms of associate's degree, the demographic groups most similar to Nepalese are Salvadoran (39.0%, a difference of 0.0%), Black/African American (39.1%, a difference of 0.25%), Honduran (38.9%, a difference of 0.29%), Cherokee (38.9%, a difference of 0.46%), and Dominican (39.3%, a difference of 0.54%).
| Demographics | Rating | Rank | Associate's Degree |
| Immigrants | Caribbean | 0.0 /100 | #286 | Tragic 39.7% |
| Aleuts | 0.0 /100 | #287 | Tragic 39.6% |
| Immigrants | Cuba | 0.0 /100 | #288 | Tragic 39.5% |
| Central Americans | 0.0 /100 | #289 | Tragic 39.4% |
| Immigrants | Haiti | 0.0 /100 | #290 | Tragic 39.3% |
| Dominicans | 0.0 /100 | #291 | Tragic 39.3% |
| Blacks/African Americans | 0.0 /100 | #292 | Tragic 39.1% |
| Nepalese | 0.0 /100 | #293 | Tragic 39.0% |
| Salvadorans | 0.0 /100 | #294 | Tragic 39.0% |
| Hondurans | 0.0 /100 | #295 | Tragic 38.9% |
| Cherokee | 0.0 /100 | #296 | Tragic 38.9% |
| Cape Verdeans | 0.0 /100 | #297 | Tragic 38.8% |
| Cheyenne | 0.0 /100 | #298 | Tragic 38.7% |
| Ute | 0.0 /100 | #299 | Tragic 38.6% |
| Chickasaw | 0.0 /100 | #300 | Tragic 38.6% |
Demographics Similar to Immigrants from Panama by Associate's Degree
In terms of associate's degree, the demographic groups most similar to Immigrants from Panama are Immigrants from Middle Africa (44.7%, a difference of 0.060%), Immigrants from Nigeria (44.6%, a difference of 0.18%), Immigrants from Ghana (44.8%, a difference of 0.31%), Immigrants (44.5%, a difference of 0.37%), and French Canadian (44.9%, a difference of 0.43%).
| Demographics | Rating | Rank | Associate's Degree |
| Dutch | 17.6 /100 | #208 | Poor 45.0% |
| Immigrants | Costa Rica | 16.7 /100 | #209 | Poor 45.0% |
| Immigrants | Philippines | 16.7 /100 | #210 | Poor 45.0% |
| Immigrants | Zaire | 16.6 /100 | #211 | Poor 45.0% |
| French Canadians | 15.0 /100 | #212 | Poor 44.9% |
| Immigrants | Ghana | 14.2 /100 | #213 | Poor 44.8% |
| Immigrants | Middle Africa | 12.7 /100 | #214 | Poor 44.7% |
| Immigrants | Panama | 12.4 /100 | #215 | Poor 44.7% |
| Immigrants | Nigeria | 11.4 /100 | #216 | Poor 44.6% |
| Immigrants | Immigrants | 10.5 /100 | #217 | Poor 44.5% |
| Spanish | 9.4 /100 | #218 | Tragic 44.4% |
| Whites/Caucasians | 7.5 /100 | #219 | Tragic 44.2% |
| Portuguese | 7.2 /100 | #220 | Tragic 44.1% |
| Immigrants | Western Africa | 6.6 /100 | #221 | Tragic 44.1% |
| Barbadians | 5.8 /100 | #222 | Tragic 43.9% |