Nepalese vs Uruguayan Currently Married
COMPARE
Nepalese
Uruguayan
Currently Married
Currently Married Comparison
Nepalese
Uruguayans
44.7%
CURRENTLY MARRIED
1.2/ 100
METRIC RATING
232nd/ 347
METRIC RANK
45.6%
CURRENTLY MARRIED
7.9/ 100
METRIC RATING
210th/ 347
METRIC RANK
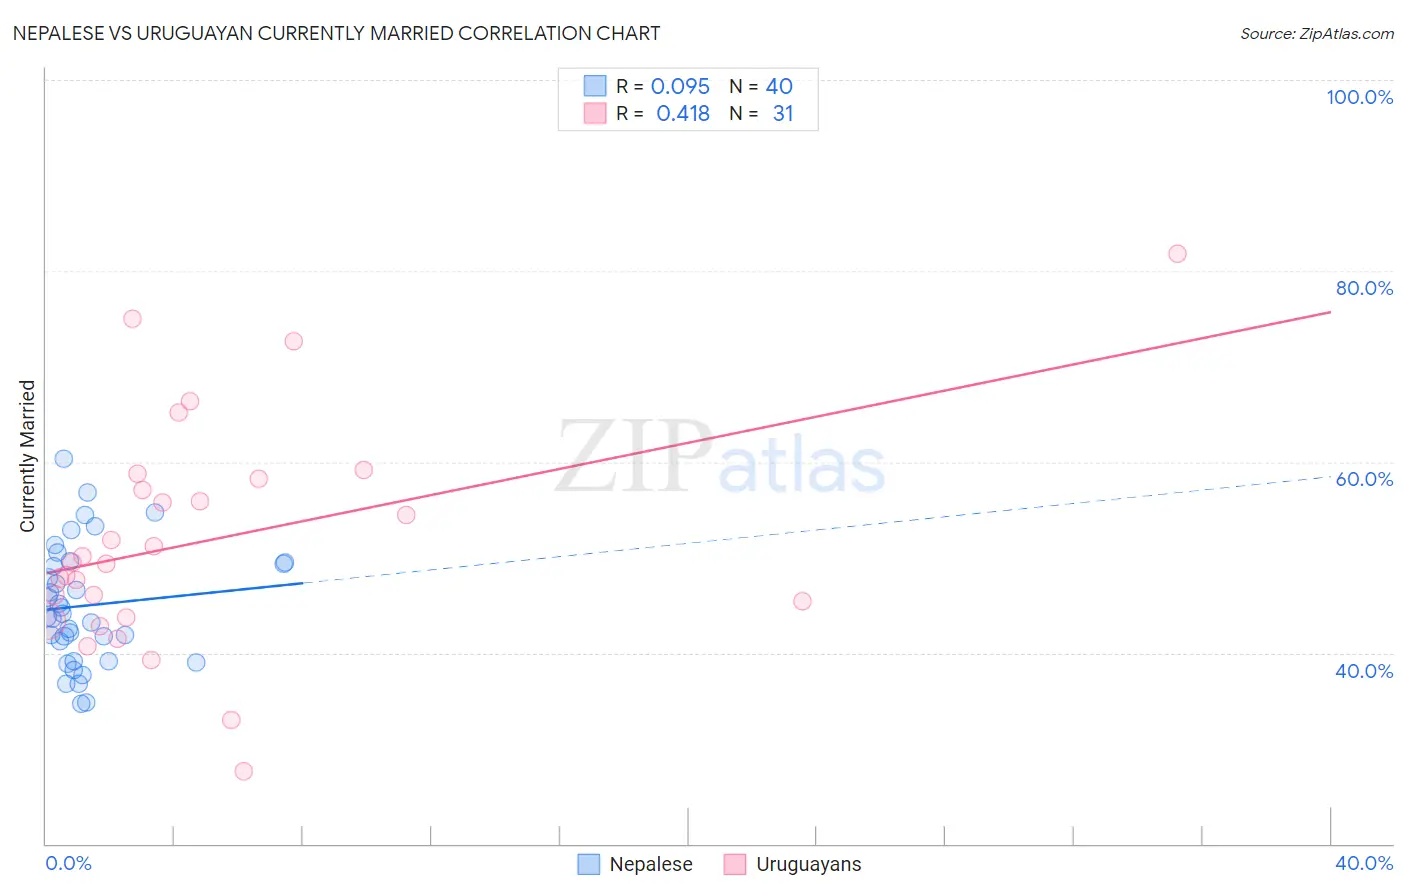
Nepalese vs Uruguayan Currently Married Correlation Chart
The statistical analysis conducted on geographies consisting of 24,521,755 people shows a slight positive correlation between the proportion of Nepalese and percentage of population currently married in the United States with a correlation coefficient (R) of 0.095 and weighted average of 44.7%. Similarly, the statistical analysis conducted on geographies consisting of 144,776,099 people shows a moderate positive correlation between the proportion of Uruguayans and percentage of population currently married in the United States with a correlation coefficient (R) of 0.418 and weighted average of 45.6%, a difference of 1.9%.
Currently Married Correlation Summary
| Measurement | Nepalese | Uruguayan |
| Minimum | 34.6% | 27.6% |
| Maximum | 60.3% | 81.8% |
| Range | 25.7% | 54.2% |
| Mean | 45.0% | 51.8% |
| Median | 44.0% | 49.5% |
| Interquartile 25% (IQ1) | 40.2% | 43.7% |
| Interquartile 75% (IQ3) | 49.3% | 58.2% |
| Interquartile Range (IQR) | 9.2% | 14.6% |
| Standard Deviation (Sample) | 6.2% | 11.8% |
| Standard Deviation (Population) | 6.2% | 11.6% |
Similar Demographics by Currently Married
Demographics Similar to Nepalese by Currently Married
In terms of currently married, the demographic groups most similar to Nepalese are Immigrants from Saudi Arabia (44.7%, a difference of 0.050%), Iroquois (44.7%, a difference of 0.060%), Alaskan Athabascan (44.6%, a difference of 0.21%), Cuban (44.6%, a difference of 0.22%), and Seminole (44.6%, a difference of 0.23%).
| Demographics | Rating | Rank | Currently Married |
| French American Indians | 2.2 /100 | #225 | Tragic 45.0% |
| Comanche | 2.1 /100 | #226 | Tragic 45.0% |
| Spanish Americans | 2.1 /100 | #227 | Tragic 45.0% |
| Immigrants | Uruguay | 2.0 /100 | #228 | Tragic 45.0% |
| Cree | 1.7 /100 | #229 | Tragic 44.9% |
| Immigrants | Kenya | 1.6 /100 | #230 | Tragic 44.9% |
| Immigrants | Panama | 1.5 /100 | #231 | Tragic 44.9% |
| Nepalese | 1.2 /100 | #232 | Tragic 44.7% |
| Immigrants | Saudi Arabia | 1.1 /100 | #233 | Tragic 44.7% |
| Iroquois | 1.1 /100 | #234 | Tragic 44.7% |
| Alaskan Athabascans | 0.9 /100 | #235 | Tragic 44.6% |
| Cubans | 0.9 /100 | #236 | Tragic 44.6% |
| Seminole | 0.9 /100 | #237 | Tragic 44.6% |
| Moroccans | 0.9 /100 | #238 | Tragic 44.6% |
| Immigrants | Mexico | 0.7 /100 | #239 | Tragic 44.5% |
Demographics Similar to Uruguayans by Currently Married
In terms of currently married, the demographic groups most similar to Uruguayans are Houma (45.5%, a difference of 0.090%), Marshallese (45.5%, a difference of 0.090%), Immigrants from Micronesia (45.6%, a difference of 0.11%), Alaska Native (45.5%, a difference of 0.12%), and Dutch West Indian (45.5%, a difference of 0.16%).
| Demographics | Rating | Rank | Currently Married |
| Taiwanese | 11.7 /100 | #203 | Poor 45.8% |
| Immigrants | Spain | 11.6 /100 | #204 | Poor 45.8% |
| South American Indians | 11.5 /100 | #205 | Poor 45.8% |
| Immigrants | Immigrants | 11.2 /100 | #206 | Poor 45.8% |
| Immigrants | South America | 10.8 /100 | #207 | Poor 45.7% |
| Alsatians | 10.8 /100 | #208 | Poor 45.7% |
| Immigrants | Micronesia | 8.8 /100 | #209 | Tragic 45.6% |
| Uruguayans | 7.9 /100 | #210 | Tragic 45.6% |
| Houma | 7.2 /100 | #211 | Tragic 45.5% |
| Marshallese | 7.2 /100 | #212 | Tragic 45.5% |
| Alaska Natives | 7.0 /100 | #213 | Tragic 45.5% |
| Dutch West Indians | 6.7 /100 | #214 | Tragic 45.5% |
| German Russians | 6.7 /100 | #215 | Tragic 45.5% |
| Immigrants | Morocco | 5.5 /100 | #216 | Tragic 45.4% |
| Immigrants | Thailand | 5.1 /100 | #217 | Tragic 45.4% |