Native/Alaskan vs Okinawan Married-couple Households
COMPARE
Native/Alaskan
Okinawan
Married-couple Households
Married-couple Households Comparison
Natives/Alaskans
Okinawans
43.5%
MARRIED-COUPLE HOUSEHOLDS
0.1/ 100
METRIC RATING
267th/ 347
METRIC RANK
47.4%
MARRIED-COUPLE HOUSEHOLDS
90.1/ 100
METRIC RATING
122nd/ 347
METRIC RANK
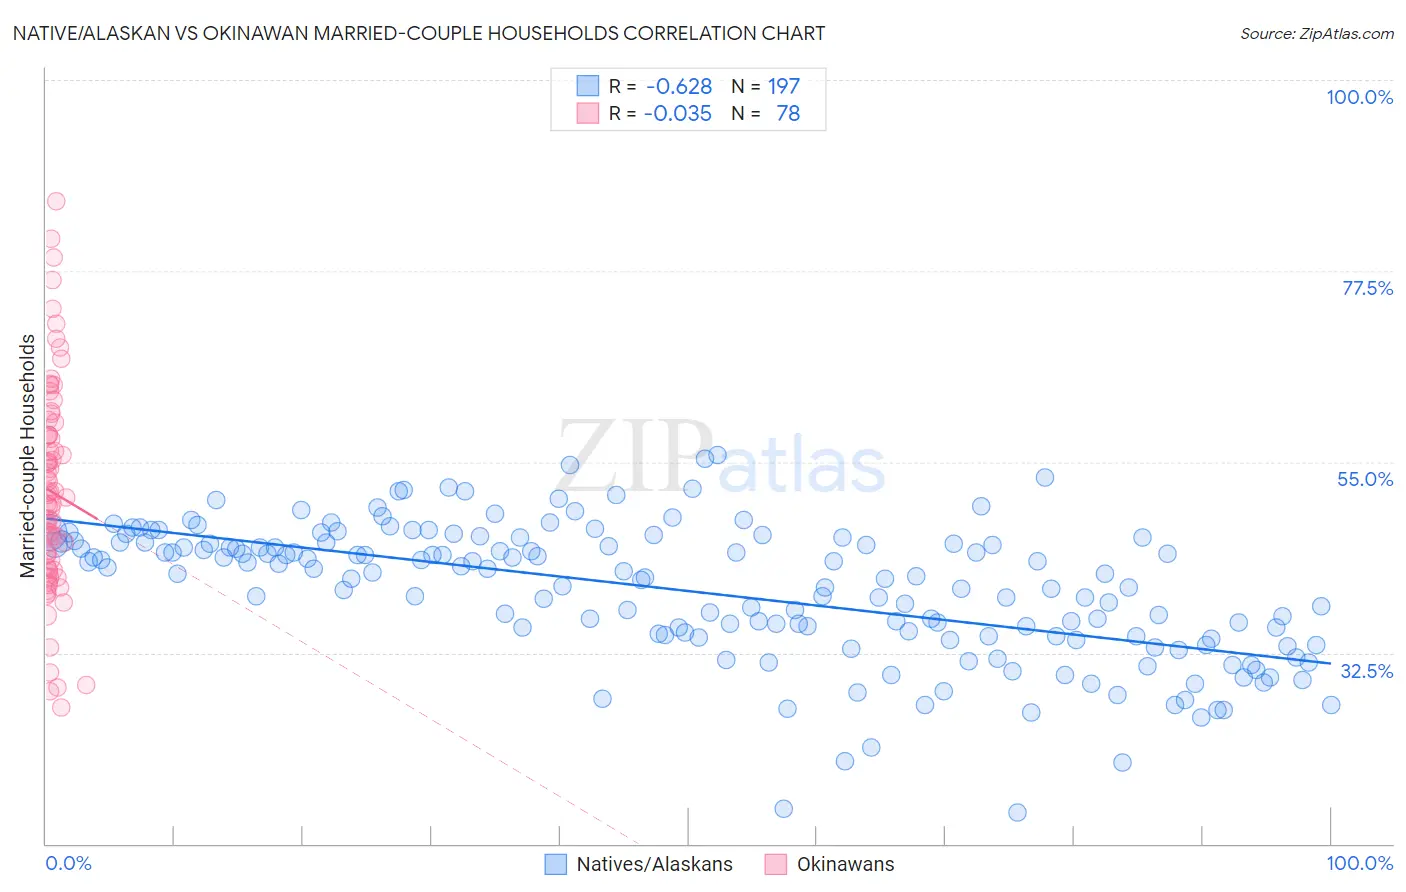
Native/Alaskan vs Okinawan Married-couple Households Correlation Chart
The statistical analysis conducted on geographies consisting of 512,631,690 people shows a significant negative correlation between the proportion of Natives/Alaskans and percentage of married-couple family households in the United States with a correlation coefficient (R) of -0.628 and weighted average of 43.5%. Similarly, the statistical analysis conducted on geographies consisting of 73,726,117 people shows no correlation between the proportion of Okinawans and percentage of married-couple family households in the United States with a correlation coefficient (R) of -0.035 and weighted average of 47.4%, a difference of 9.1%.
Married-couple Households Correlation Summary
| Measurement | Native/Alaskan | Okinawan |
| Minimum | 13.8% | 26.1% |
| Maximum | 55.8% | 85.7% |
| Range | 42.1% | 59.6% |
| Mean | 39.8% | 51.5% |
| Median | 41.7% | 50.5% |
| Interquartile 25% (IQ1) | 34.5% | 42.3% |
| Interquartile 75% (IQ3) | 45.5% | 58.1% |
| Interquartile Range (IQR) | 11.0% | 15.9% |
| Standard Deviation (Sample) | 7.9% | 12.5% |
| Standard Deviation (Population) | 7.9% | 12.4% |
Similar Demographics by Married-couple Households
Demographics Similar to Natives/Alaskans by Married-couple Households
In terms of married-couple households, the demographic groups most similar to Natives/Alaskans are Ecuadorian (43.5%, a difference of 0.050%), Moroccan (43.5%, a difference of 0.090%), Immigrants from Burma/Myanmar (43.4%, a difference of 0.10%), Bangladeshi (43.5%, a difference of 0.17%), and Cree (43.6%, a difference of 0.29%).
| Demographics | Rating | Rank | Married-couple Households |
| Immigrants | Cameroon | 0.2 /100 | #260 | Tragic 43.7% |
| Alaskan Athabascans | 0.2 /100 | #261 | Tragic 43.6% |
| Vietnamese | 0.2 /100 | #262 | Tragic 43.6% |
| Cree | 0.1 /100 | #263 | Tragic 43.6% |
| Bangladeshis | 0.1 /100 | #264 | Tragic 43.5% |
| Moroccans | 0.1 /100 | #265 | Tragic 43.5% |
| Ecuadorians | 0.1 /100 | #266 | Tragic 43.5% |
| Natives/Alaskans | 0.1 /100 | #267 | Tragic 43.5% |
| Immigrants | Burma/Myanmar | 0.1 /100 | #268 | Tragic 43.4% |
| Immigrants | Sierra Leone | 0.1 /100 | #269 | Tragic 43.3% |
| Yuman | 0.1 /100 | #270 | Tragic 43.3% |
| Guatemalans | 0.1 /100 | #271 | Tragic 43.3% |
| Immigrants | Nigeria | 0.1 /100 | #272 | Tragic 43.2% |
| Ethiopians | 0.1 /100 | #273 | Tragic 43.2% |
| Nigerians | 0.1 /100 | #274 | Tragic 43.2% |
Demographics Similar to Okinawans by Married-couple Households
In terms of married-couple households, the demographic groups most similar to Okinawans are Immigrants from Eastern Europe (47.4%, a difference of 0.020%), Puget Sound Salish (47.4%, a difference of 0.040%), Immigrants from Venezuela (47.4%, a difference of 0.080%), Zimbabwean (47.4%, a difference of 0.090%), and Australian (47.4%, a difference of 0.11%).
| Demographics | Rating | Rank | Married-couple Households |
| Slovaks | 92.9 /100 | #115 | Exceptional 47.6% |
| Argentineans | 92.5 /100 | #116 | Exceptional 47.5% |
| French Canadians | 92.4 /100 | #117 | Exceptional 47.5% |
| Immigrants | Germany | 92.4 /100 | #118 | Exceptional 47.5% |
| Chileans | 92.2 /100 | #119 | Exceptional 47.5% |
| Puget Sound Salish | 90.5 /100 | #120 | Exceptional 47.4% |
| Immigrants | Eastern Europe | 90.3 /100 | #121 | Exceptional 47.4% |
| Okinawans | 90.1 /100 | #122 | Exceptional 47.4% |
| Immigrants | Venezuela | 89.3 /100 | #123 | Excellent 47.4% |
| Zimbabweans | 89.2 /100 | #124 | Excellent 47.4% |
| Australians | 89.0 /100 | #125 | Excellent 47.4% |
| Pakistanis | 88.6 /100 | #126 | Excellent 47.3% |
| Celtics | 88.1 /100 | #127 | Excellent 47.3% |
| Immigrants | Peru | 87.9 /100 | #128 | Excellent 47.3% |
| Immigrants | Iraq | 87.8 /100 | #129 | Excellent 47.3% |