Creek vs Immigrants from Northern Africa Single Father Households
COMPARE
Creek
Immigrants from Northern Africa
Single Father Households
Single Father Households Comparison
Creek
Immigrants from Northern Africa
2.6%
SINGLE FATHER HOUSEHOLDS
0.2/ 100
METRIC RATING
271st/ 347
METRIC RANK
2.1%
SINGLE FATHER HOUSEHOLDS
99.0/ 100
METRIC RATING
100th/ 347
METRIC RANK
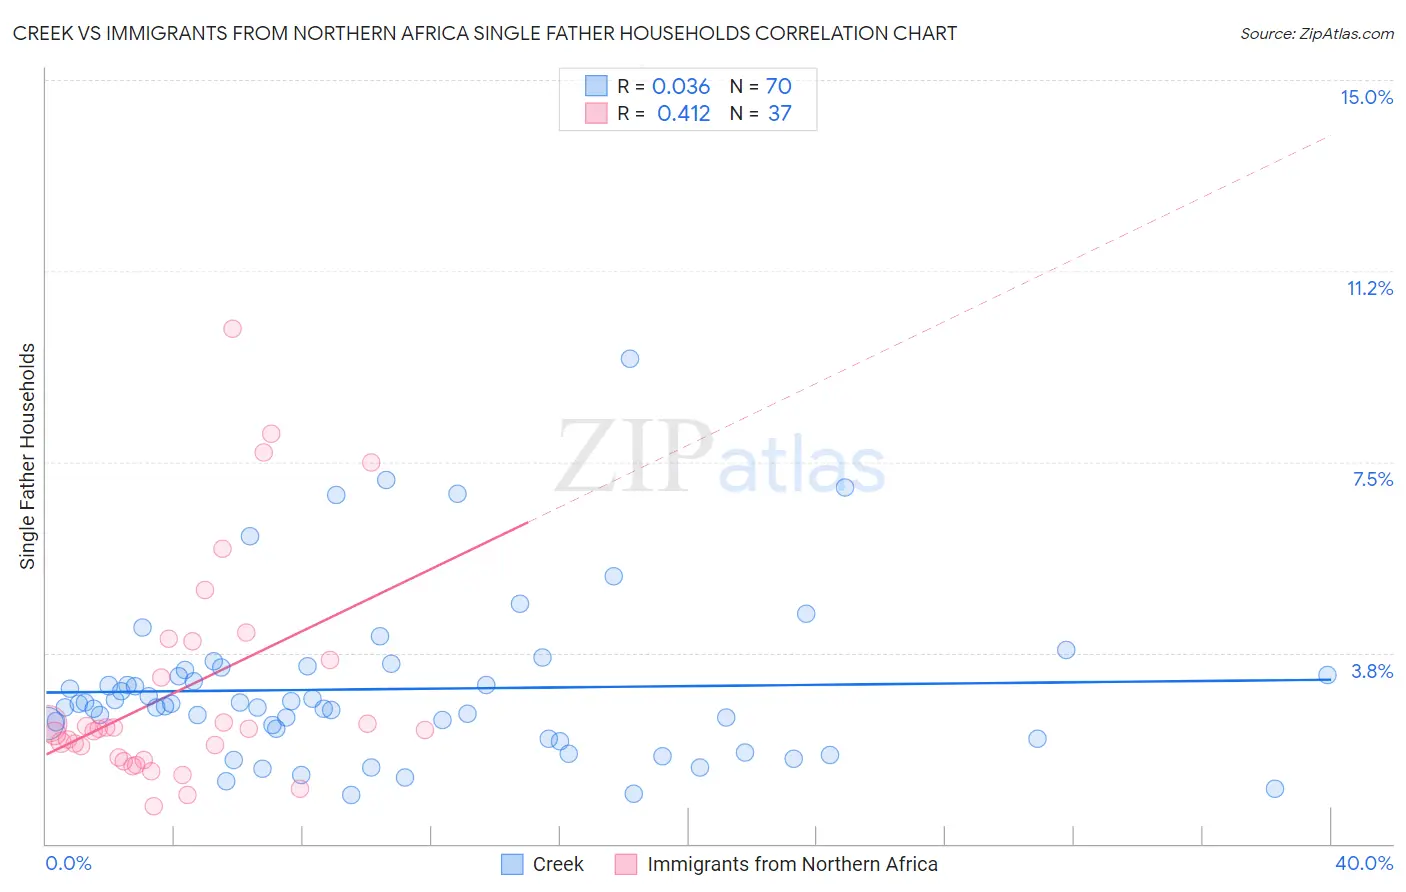
Creek vs Immigrants from Northern Africa Single Father Households Correlation Chart
The statistical analysis conducted on geographies consisting of 177,693,364 people shows no correlation between the proportion of Creek and percentage of single father households in the United States with a correlation coefficient (R) of 0.036 and weighted average of 2.6%. Similarly, the statistical analysis conducted on geographies consisting of 319,229,485 people shows a moderate positive correlation between the proportion of Immigrants from Northern Africa and percentage of single father households in the United States with a correlation coefficient (R) of 0.412 and weighted average of 2.1%, a difference of 21.5%.
Single Father Households Correlation Summary
| Measurement | Creek | Immigrants from Northern Africa |
| Minimum | 0.96% | 0.74% |
| Maximum | 9.5% | 10.1% |
| Range | 8.6% | 9.4% |
| Mean | 3.0% | 3.0% |
| Median | 2.7% | 2.3% |
| Interquartile 25% (IQ1) | 2.1% | 1.7% |
| Interquartile 75% (IQ3) | 3.4% | 3.8% |
| Interquartile Range (IQR) | 1.3% | 2.1% |
| Standard Deviation (Sample) | 1.6% | 2.2% |
| Standard Deviation (Population) | 1.6% | 2.2% |
Similar Demographics by Single Father Households
Demographics Similar to Creek by Single Father Households
In terms of single father households, the demographic groups most similar to Creek are Belizean (2.6%, a difference of 0.0%), Iroquois (2.6%, a difference of 0.050%), Puerto Rican (2.6%, a difference of 0.070%), Seminole (2.6%, a difference of 0.36%), and Cuban (2.6%, a difference of 0.50%).
| Demographics | Rating | Rank | Single Father Households |
| Indonesians | 0.5 /100 | #264 | Tragic 2.6% |
| Immigrants | Micronesia | 0.5 /100 | #265 | Tragic 2.6% |
| French American Indians | 0.5 /100 | #266 | Tragic 2.6% |
| Guamanians/Chamorros | 0.4 /100 | #267 | Tragic 2.6% |
| Haitians | 0.4 /100 | #268 | Tragic 2.6% |
| Cubans | 0.3 /100 | #269 | Tragic 2.6% |
| Seminole | 0.3 /100 | #270 | Tragic 2.6% |
| Creek | 0.2 /100 | #271 | Tragic 2.6% |
| Belizeans | 0.2 /100 | #272 | Tragic 2.6% |
| Iroquois | 0.2 /100 | #273 | Tragic 2.6% |
| Puerto Ricans | 0.2 /100 | #274 | Tragic 2.6% |
| Immigrants | Dominican Republic | 0.2 /100 | #275 | Tragic 2.6% |
| Immigrants | Haiti | 0.1 /100 | #276 | Tragic 2.6% |
| Shoshone | 0.1 /100 | #277 | Tragic 2.6% |
| Cherokee | 0.1 /100 | #278 | Tragic 2.6% |
Demographics Similar to Immigrants from Northern Africa by Single Father Households
In terms of single father households, the demographic groups most similar to Immigrants from Northern Africa are South African (2.1%, a difference of 0.15%), Immigrants from Western Europe (2.1%, a difference of 0.15%), Argentinean (2.1%, a difference of 0.18%), Guyanese (2.1%, a difference of 0.19%), and Lebanese (2.1%, a difference of 0.20%).
| Demographics | Rating | Rank | Single Father Households |
| Croatians | 99.3 /100 | #93 | Exceptional 2.1% |
| Ukrainians | 99.3 /100 | #94 | Exceptional 2.1% |
| Bermudans | 99.2 /100 | #95 | Exceptional 2.1% |
| Arabs | 99.2 /100 | #96 | Exceptional 2.1% |
| Immigrants | Moldova | 99.1 /100 | #97 | Exceptional 2.1% |
| Guyanese | 99.1 /100 | #98 | Exceptional 2.1% |
| South Africans | 99.1 /100 | #99 | Exceptional 2.1% |
| Immigrants | Northern Africa | 99.0 /100 | #100 | Exceptional 2.1% |
| Immigrants | Western Europe | 98.9 /100 | #101 | Exceptional 2.1% |
| Argentineans | 98.9 /100 | #102 | Exceptional 2.1% |
| Lebanese | 98.9 /100 | #103 | Exceptional 2.1% |
| Alsatians | 98.9 /100 | #104 | Exceptional 2.1% |
| Palestinians | 98.6 /100 | #105 | Exceptional 2.2% |
| Immigrants | Southern Europe | 98.6 /100 | #106 | Exceptional 2.2% |
| Slovenes | 98.5 /100 | #107 | Exceptional 2.2% |