Immigrants from Singapore vs Immigrants from Bolivia Births to Unmarried Women
COMPARE
Immigrants from Singapore
Immigrants from Bolivia
Births to Unmarried Women
Births to Unmarried Women Comparison
Immigrants from Singapore
Immigrants from Bolivia
25.6%
BIRTHS TO UNMARRIED WOMEN
100.0/ 100
METRIC RATING
15th/ 347
METRIC RANK
28.6%
BIRTHS TO UNMARRIED WOMEN
98.5/ 100
METRIC RATING
74th/ 347
METRIC RANK
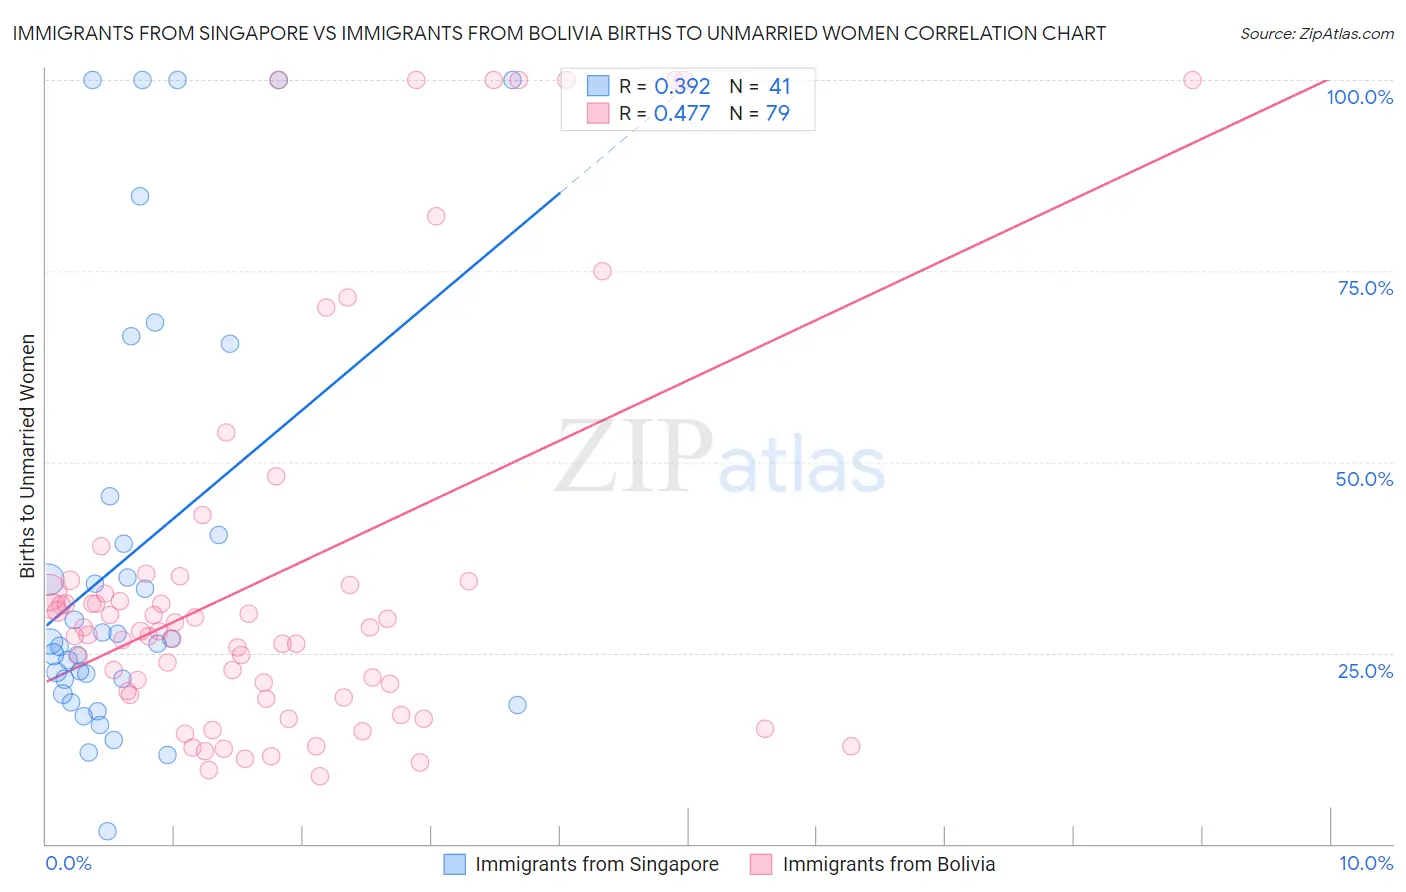
Immigrants from Singapore vs Immigrants from Bolivia Births to Unmarried Women Correlation Chart
The statistical analysis conducted on geographies consisting of 131,320,191 people shows a mild positive correlation between the proportion of Immigrants from Singapore and percentage of births to unmarried women in the United States with a correlation coefficient (R) of 0.392 and weighted average of 25.6%. Similarly, the statistical analysis conducted on geographies consisting of 153,801,306 people shows a moderate positive correlation between the proportion of Immigrants from Bolivia and percentage of births to unmarried women in the United States with a correlation coefficient (R) of 0.477 and weighted average of 28.6%, a difference of 11.4%.
Births to Unmarried Women Correlation Summary
| Measurement | Immigrants from Singapore | Immigrants from Bolivia |
| Minimum | 1.7% | 8.9% |
| Maximum | 100.0% | 100.0% |
| Range | 98.3% | 91.1% |
| Mean | 38.2% | 35.2% |
| Median | 26.5% | 27.9% |
| Interquartile 25% (IQ1) | 20.6% | 19.4% |
| Interquartile 75% (IQ3) | 43.0% | 34.4% |
| Interquartile Range (IQR) | 22.4% | 15.0% |
| Standard Deviation (Sample) | 28.5% | 25.9% |
| Standard Deviation (Population) | 28.1% | 25.8% |
Similar Demographics by Births to Unmarried Women
Demographics Similar to Immigrants from Singapore by Births to Unmarried Women
In terms of births to unmarried women, the demographic groups most similar to Immigrants from Singapore are Immigrants from Belarus (25.6%, a difference of 0.050%), Immigrants from Uzbekistan (25.8%, a difference of 0.62%), Immigrants from Lebanon (25.3%, a difference of 1.2%), Iranian (25.3%, a difference of 1.3%), and Indian (Asian) (25.3%, a difference of 1.4%).
| Demographics | Rating | Rank | Births to Unmarried Women |
| Immigrants | China | 100.0 /100 | #8 | Exceptional 24.7% |
| Immigrants | South Central Asia | 100.0 /100 | #9 | Exceptional 24.7% |
| Immigrants | Eastern Asia | 100.0 /100 | #10 | Exceptional 25.0% |
| Immigrants | Israel | 100.0 /100 | #11 | Exceptional 25.1% |
| Indians (Asian) | 100.0 /100 | #12 | Exceptional 25.3% |
| Iranians | 100.0 /100 | #13 | Exceptional 25.3% |
| Immigrants | Lebanon | 100.0 /100 | #14 | Exceptional 25.3% |
| Immigrants | Singapore | 100.0 /100 | #15 | Exceptional 25.6% |
| Immigrants | Belarus | 100.0 /100 | #16 | Exceptional 25.6% |
| Immigrants | Uzbekistan | 100.0 /100 | #17 | Exceptional 25.8% |
| Immigrants | Armenia | 99.9 /100 | #18 | Exceptional 26.1% |
| Armenians | 99.9 /100 | #19 | Exceptional 26.2% |
| Immigrants | Korea | 99.9 /100 | #20 | Exceptional 26.3% |
| Soviet Union | 99.9 /100 | #21 | Exceptional 26.3% |
| Burmese | 99.9 /100 | #22 | Exceptional 26.4% |
Demographics Similar to Immigrants from Bolivia by Births to Unmarried Women
In terms of births to unmarried women, the demographic groups most similar to Immigrants from Bolivia are Albanian (28.5%, a difference of 0.020%), Immigrants from Sweden (28.5%, a difference of 0.070%), Immigrants from Switzerland (28.6%, a difference of 0.090%), Israeli (28.6%, a difference of 0.10%), and Jordanian (28.5%, a difference of 0.13%).
| Demographics | Rating | Rank | Births to Unmarried Women |
| Palestinians | 98.7 /100 | #67 | Exceptional 28.4% |
| Immigrants | Europe | 98.7 /100 | #68 | Exceptional 28.4% |
| Bolivians | 98.7 /100 | #69 | Exceptional 28.5% |
| Laotians | 98.6 /100 | #70 | Exceptional 28.5% |
| Jordanians | 98.5 /100 | #71 | Exceptional 28.5% |
| Immigrants | Sweden | 98.5 /100 | #72 | Exceptional 28.5% |
| Albanians | 98.5 /100 | #73 | Exceptional 28.5% |
| Immigrants | Bolivia | 98.5 /100 | #74 | Exceptional 28.6% |
| Immigrants | Switzerland | 98.4 /100 | #75 | Exceptional 28.6% |
| Israelis | 98.4 /100 | #76 | Exceptional 28.6% |
| Immigrants | Northern Europe | 98.3 /100 | #77 | Exceptional 28.6% |
| Zimbabweans | 98.2 /100 | #78 | Exceptional 28.7% |
| Danes | 98.2 /100 | #79 | Exceptional 28.7% |
| Immigrants | Afghanistan | 98.1 /100 | #80 | Exceptional 28.7% |
| Immigrants | Austria | 98.1 /100 | #81 | Exceptional 28.7% |