Yakama vs Barbadian Single Father Households
COMPARE
Yakama
Barbadian
Single Father Households
Single Father Households Comparison
Yakama
Barbadians
4.2%
SINGLE FATHER HOUSEHOLDS
0.0/ 100
METRIC RATING
344th/ 347
METRIC RANK
2.2%
SINGLE FATHER HOUSEHOLDS
98.4/ 100
METRIC RATING
109th/ 347
METRIC RANK
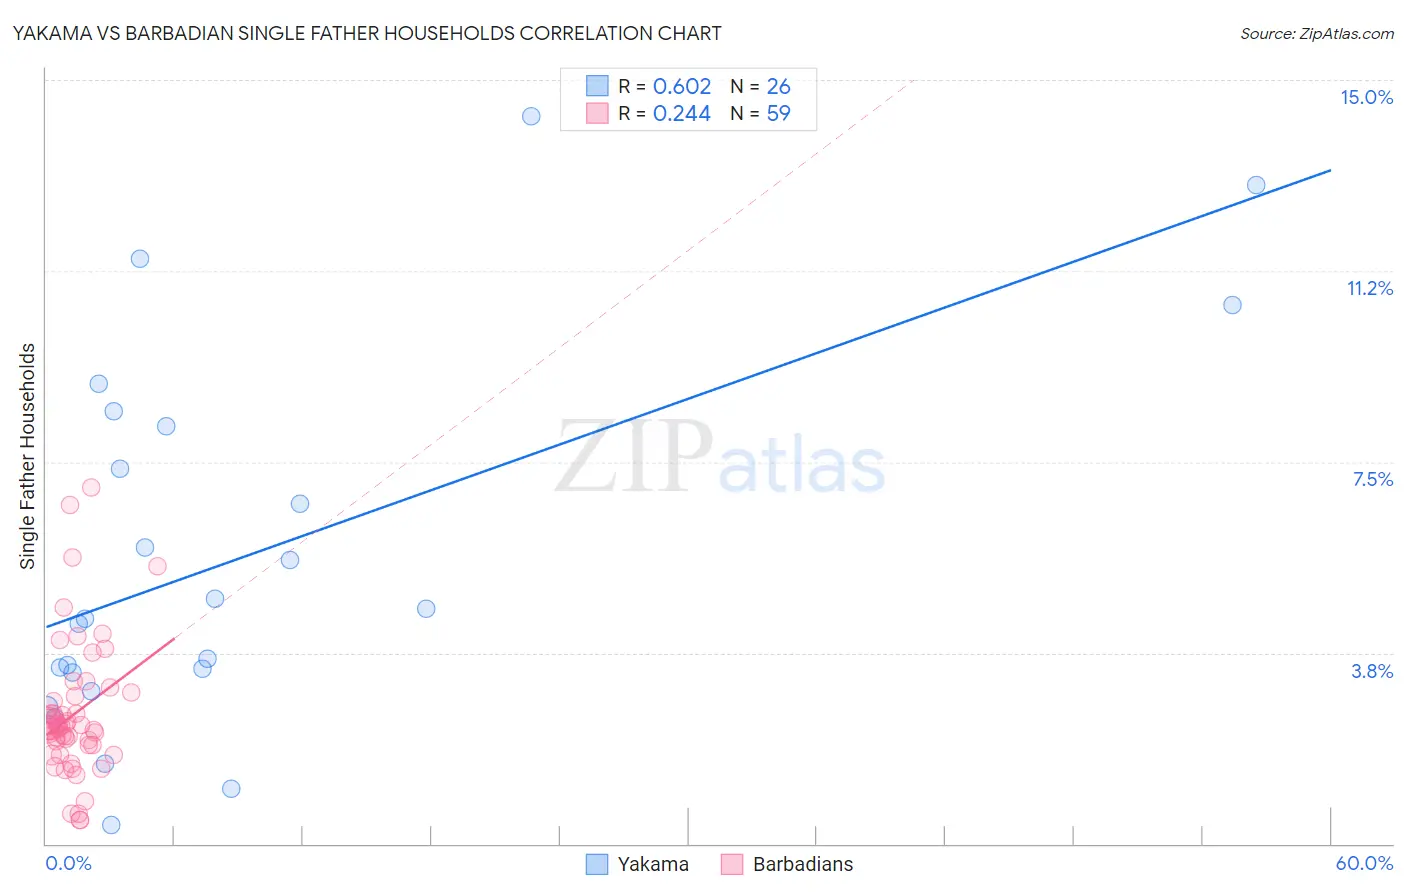
Yakama vs Barbadian Single Father Households Correlation Chart
The statistical analysis conducted on geographies consisting of 19,884,653 people shows a significant positive correlation between the proportion of Yakama and percentage of single father households in the United States with a correlation coefficient (R) of 0.602 and weighted average of 4.2%. Similarly, the statistical analysis conducted on geographies consisting of 140,972,494 people shows a weak positive correlation between the proportion of Barbadians and percentage of single father households in the United States with a correlation coefficient (R) of 0.244 and weighted average of 2.2%, a difference of 93.8%.
Single Father Households Correlation Summary
| Measurement | Yakama | Barbadian |
| Minimum | 0.37% | 0.46% |
| Maximum | 14.3% | 7.0% |
| Range | 13.9% | 6.5% |
| Mean | 5.7% | 2.5% |
| Median | 4.5% | 2.3% |
| Interquartile 25% (IQ1) | 3.4% | 1.9% |
| Interquartile 75% (IQ3) | 8.2% | 2.9% |
| Interquartile Range (IQR) | 4.8% | 0.95% |
| Standard Deviation (Sample) | 3.7% | 1.3% |
| Standard Deviation (Population) | 3.6% | 1.3% |
Similar Demographics by Single Father Households
Demographics Similar to Yakama by Single Father Households
In terms of single father households, the demographic groups most similar to Yakama are Pima (4.2%, a difference of 0.24%), Menominee (4.2%, a difference of 0.69%), Tohono O'odham (3.8%, a difference of 9.5%), Inupiat (4.9%, a difference of 16.2%), and Crow (3.5%, a difference of 19.1%).
| Demographics | Rating | Rank | Single Father Households |
| Natives/Alaskans | 0.0 /100 | #333 | Tragic 3.2% |
| Yuman | 0.0 /100 | #334 | Tragic 3.3% |
| Colville | 0.0 /100 | #335 | Tragic 3.3% |
| Paiute | 0.0 /100 | #336 | Tragic 3.3% |
| Pueblo | 0.0 /100 | #337 | Tragic 3.3% |
| Sioux | 0.0 /100 | #338 | Tragic 3.3% |
| Alaskan Athabascans | 0.0 /100 | #339 | Tragic 3.4% |
| Alaska Natives | 0.0 /100 | #340 | Tragic 3.5% |
| Crow | 0.0 /100 | #341 | Tragic 3.5% |
| Tohono O'odham | 0.0 /100 | #342 | Tragic 3.8% |
| Pima | 0.0 /100 | #343 | Tragic 4.2% |
| Yakama | 0.0 /100 | #344 | Tragic 4.2% |
| Menominee | 0.0 /100 | #345 | Tragic 4.2% |
| Inupiat | 0.0 /100 | #346 | Tragic 4.9% |
| Yup'ik | 0.0 /100 | #347 | Tragic 5.4% |
Demographics Similar to Barbadians by Single Father Households
In terms of single father households, the demographic groups most similar to Barbadians are Immigrants from Netherlands (2.2%, a difference of 0.040%), Slovene (2.2%, a difference of 0.060%), Italian (2.2%, a difference of 0.13%), Immigrants from Southern Europe (2.2%, a difference of 0.17%), and Immigrants from Canada (2.2%, a difference of 0.21%).
| Demographics | Rating | Rank | Single Father Households |
| Argentineans | 98.9 /100 | #102 | Exceptional 2.1% |
| Lebanese | 98.9 /100 | #103 | Exceptional 2.1% |
| Alsatians | 98.9 /100 | #104 | Exceptional 2.1% |
| Palestinians | 98.6 /100 | #105 | Exceptional 2.2% |
| Immigrants | Southern Europe | 98.6 /100 | #106 | Exceptional 2.2% |
| Slovenes | 98.5 /100 | #107 | Exceptional 2.2% |
| Immigrants | Netherlands | 98.5 /100 | #108 | Exceptional 2.2% |
| Barbadians | 98.4 /100 | #109 | Exceptional 2.2% |
| Italians | 98.3 /100 | #110 | Exceptional 2.2% |
| Immigrants | Canada | 98.3 /100 | #111 | Exceptional 2.2% |
| Immigrants | Trinidad and Tobago | 98.2 /100 | #112 | Exceptional 2.2% |
| Iraqis | 98.2 /100 | #113 | Exceptional 2.2% |
| Immigrants | North America | 98.2 /100 | #114 | Exceptional 2.2% |
| Immigrants | Barbados | 98.2 /100 | #115 | Exceptional 2.2% |
| Immigrants | Argentina | 98.1 /100 | #116 | Exceptional 2.2% |