Immigrants from Liberia vs Barbadian Single Father Households
COMPARE
Immigrants from Liberia
Barbadian
Single Father Households
Single Father Households Comparison
Immigrants from Liberia
Barbadians
2.5%
SINGLE FATHER HOUSEHOLDS
0.8/ 100
METRIC RATING
262nd/ 347
METRIC RANK
2.2%
SINGLE FATHER HOUSEHOLDS
98.4/ 100
METRIC RATING
109th/ 347
METRIC RANK
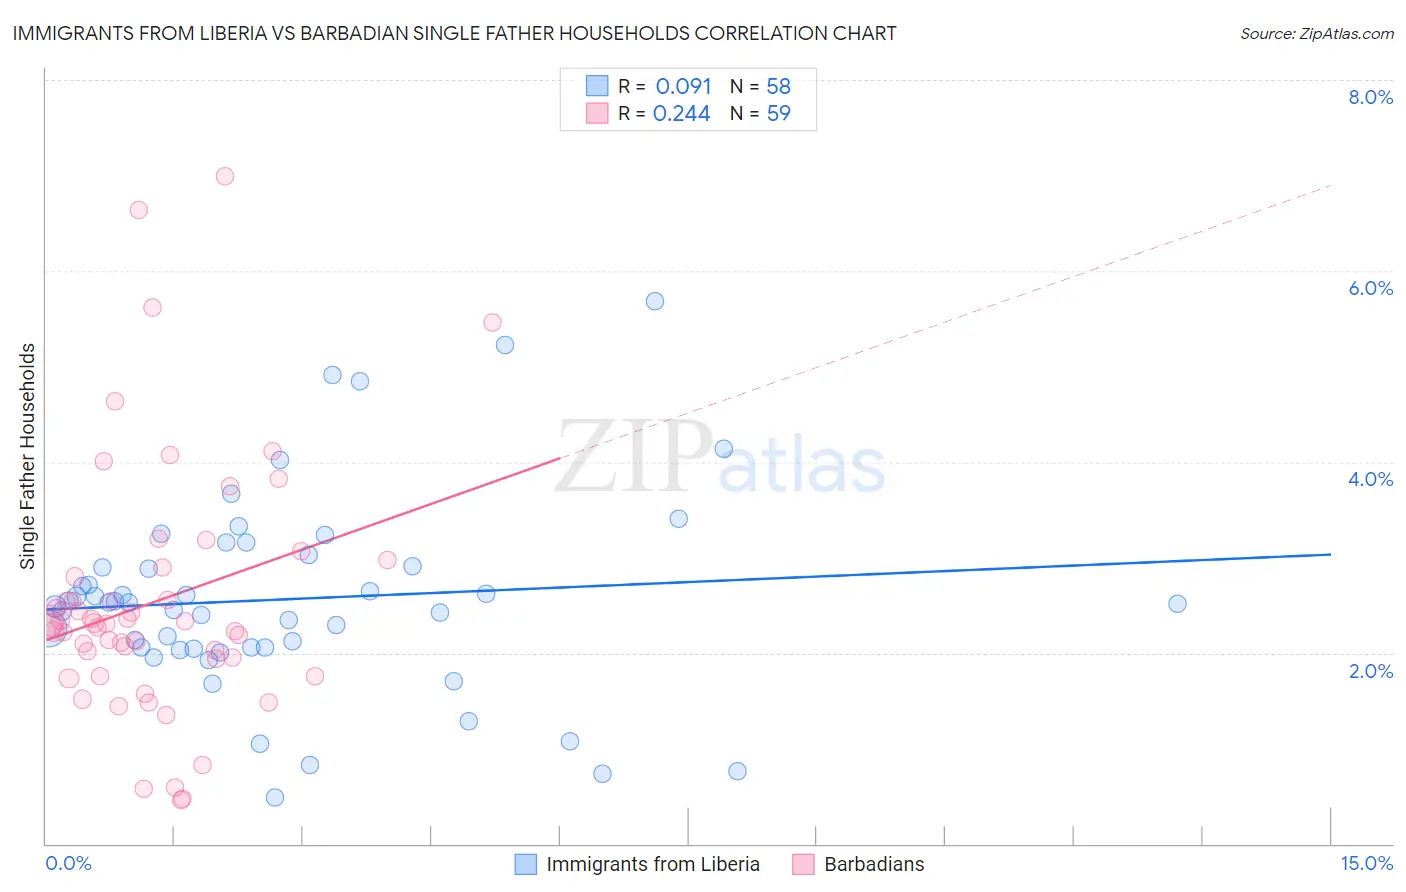
Immigrants from Liberia vs Barbadian Single Father Households Correlation Chart
The statistical analysis conducted on geographies consisting of 135,021,934 people shows a slight positive correlation between the proportion of Immigrants from Liberia and percentage of single father households in the United States with a correlation coefficient (R) of 0.091 and weighted average of 2.5%. Similarly, the statistical analysis conducted on geographies consisting of 140,972,494 people shows a weak positive correlation between the proportion of Barbadians and percentage of single father households in the United States with a correlation coefficient (R) of 0.244 and weighted average of 2.2%, a difference of 17.8%.
Single Father Households Correlation Summary
| Measurement | Immigrants from Liberia | Barbadian |
| Minimum | 0.48% | 0.46% |
| Maximum | 5.7% | 7.0% |
| Range | 5.2% | 6.5% |
| Mean | 2.6% | 2.5% |
| Median | 2.5% | 2.3% |
| Interquartile 25% (IQ1) | 2.1% | 1.9% |
| Interquartile 75% (IQ3) | 2.9% | 2.9% |
| Interquartile Range (IQR) | 0.86% | 0.95% |
| Standard Deviation (Sample) | 1.0% | 1.3% |
| Standard Deviation (Population) | 1.0% | 1.3% |
Similar Demographics by Single Father Households
Demographics Similar to Immigrants from Liberia by Single Father Households
In terms of single father households, the demographic groups most similar to Immigrants from Liberia are Dominican (2.5%, a difference of 0.13%), Immigrants from Belize (2.5%, a difference of 0.15%), Immigrants from Caribbean (2.5%, a difference of 0.31%), Comanche (2.5%, a difference of 0.40%), and Spanish (2.5%, a difference of 0.55%).
| Demographics | Rating | Rank | Single Father Households |
| Tongans | 1.5 /100 | #255 | Tragic 2.5% |
| Potawatomi | 1.4 /100 | #256 | Tragic 2.5% |
| Immigrants | Congo | 1.2 /100 | #257 | Tragic 2.5% |
| Spanish | 1.1 /100 | #258 | Tragic 2.5% |
| Comanche | 1.0 /100 | #259 | Tragic 2.5% |
| Immigrants | Caribbean | 1.0 /100 | #260 | Tragic 2.5% |
| Immigrants | Belize | 0.9 /100 | #261 | Tragic 2.5% |
| Immigrants | Liberia | 0.8 /100 | #262 | Tragic 2.5% |
| Dominicans | 0.8 /100 | #263 | Tragic 2.5% |
| Indonesians | 0.5 /100 | #264 | Tragic 2.6% |
| Immigrants | Micronesia | 0.5 /100 | #265 | Tragic 2.6% |
| French American Indians | 0.5 /100 | #266 | Tragic 2.6% |
| Guamanians/Chamorros | 0.4 /100 | #267 | Tragic 2.6% |
| Haitians | 0.4 /100 | #268 | Tragic 2.6% |
| Cubans | 0.3 /100 | #269 | Tragic 2.6% |
Demographics Similar to Barbadians by Single Father Households
In terms of single father households, the demographic groups most similar to Barbadians are Immigrants from Netherlands (2.2%, a difference of 0.040%), Slovene (2.2%, a difference of 0.060%), Italian (2.2%, a difference of 0.13%), Immigrants from Southern Europe (2.2%, a difference of 0.17%), and Immigrants from Canada (2.2%, a difference of 0.21%).
| Demographics | Rating | Rank | Single Father Households |
| Argentineans | 98.9 /100 | #102 | Exceptional 2.1% |
| Lebanese | 98.9 /100 | #103 | Exceptional 2.1% |
| Alsatians | 98.9 /100 | #104 | Exceptional 2.1% |
| Palestinians | 98.6 /100 | #105 | Exceptional 2.2% |
| Immigrants | Southern Europe | 98.6 /100 | #106 | Exceptional 2.2% |
| Slovenes | 98.5 /100 | #107 | Exceptional 2.2% |
| Immigrants | Netherlands | 98.5 /100 | #108 | Exceptional 2.2% |
| Barbadians | 98.4 /100 | #109 | Exceptional 2.2% |
| Italians | 98.3 /100 | #110 | Exceptional 2.2% |
| Immigrants | Canada | 98.3 /100 | #111 | Exceptional 2.2% |
| Immigrants | Trinidad and Tobago | 98.2 /100 | #112 | Exceptional 2.2% |
| Iraqis | 98.2 /100 | #113 | Exceptional 2.2% |
| Immigrants | North America | 98.2 /100 | #114 | Exceptional 2.2% |
| Immigrants | Barbados | 98.2 /100 | #115 | Exceptional 2.2% |
| Immigrants | Argentina | 98.1 /100 | #116 | Exceptional 2.2% |