Uruguayan vs Immigrants from Vietnam Family Households
COMPARE
Uruguayan
Immigrants from Vietnam
Family Households
Family Households Comparison
Uruguayans
Immigrants from Vietnam
64.5%
FAMILY HOUSEHOLDS
67.7/ 100
METRIC RATING
155th/ 347
METRIC RANK
68.2%
FAMILY HOUSEHOLDS
100.0/ 100
METRIC RATING
16th/ 347
METRIC RANK
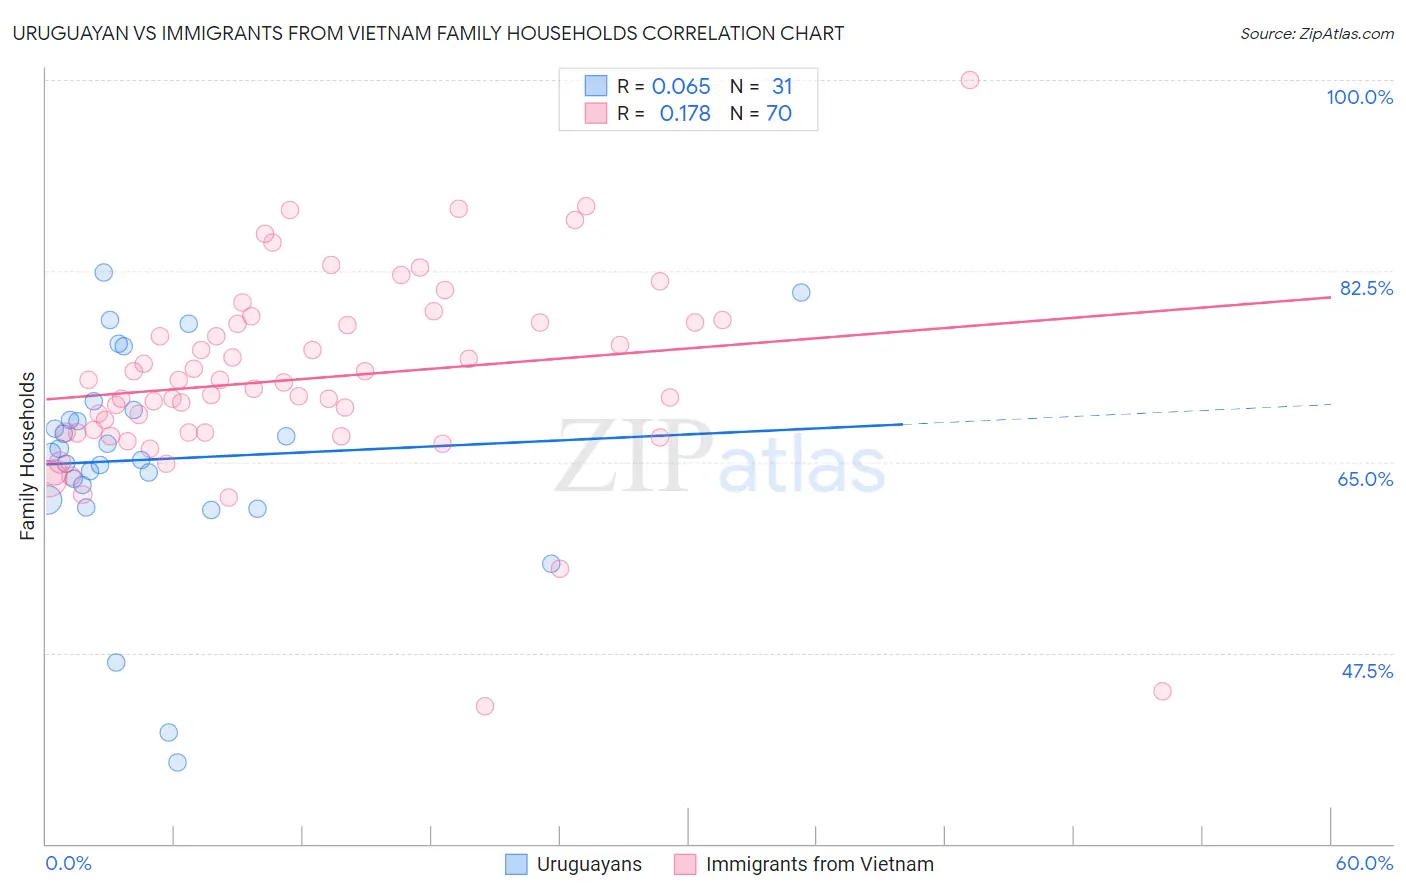
Uruguayan vs Immigrants from Vietnam Family Households Correlation Chart
The statistical analysis conducted on geographies consisting of 144,759,449 people shows a slight positive correlation between the proportion of Uruguayans and percentage of family households in the United States with a correlation coefficient (R) of 0.065 and weighted average of 64.5%. Similarly, the statistical analysis conducted on geographies consisting of 404,558,731 people shows a poor positive correlation between the proportion of Immigrants from Vietnam and percentage of family households in the United States with a correlation coefficient (R) of 0.178 and weighted average of 68.2%, a difference of 5.8%.
Family Households Correlation Summary
| Measurement | Uruguayan | Immigrants from Vietnam |
| Minimum | 37.5% | 42.7% |
| Maximum | 82.3% | 100.0% |
| Range | 44.8% | 57.3% |
| Mean | 65.2% | 72.6% |
| Median | 65.8% | 72.0% |
| Interquartile 25% (IQ1) | 61.5% | 67.7% |
| Interquartile 75% (IQ3) | 69.7% | 77.7% |
| Interquartile Range (IQR) | 8.2% | 10.0% |
| Standard Deviation (Sample) | 10.1% | 9.2% |
| Standard Deviation (Population) | 10.0% | 9.1% |
Similar Demographics by Family Households
Demographics Similar to Uruguayans by Family Households
In terms of family households, the demographic groups most similar to Uruguayans are Austrian (64.5%, a difference of 0.010%), Czech (64.5%, a difference of 0.010%), Canadian (64.4%, a difference of 0.020%), Lebanese (64.4%, a difference of 0.020%), and Swedish (64.5%, a difference of 0.030%).
| Demographics | Rating | Rank | Family Households |
| Delaware | 76.3 /100 | #148 | Good 64.6% |
| Sioux | 76.3 /100 | #149 | Good 64.6% |
| Romanians | 75.3 /100 | #150 | Good 64.5% |
| Syrians | 75.2 /100 | #151 | Good 64.5% |
| Scottish | 70.9 /100 | #152 | Good 64.5% |
| Swedes | 69.8 /100 | #153 | Good 64.5% |
| Austrians | 68.5 /100 | #154 | Good 64.5% |
| Uruguayans | 67.7 /100 | #155 | Good 64.5% |
| Czechs | 67.0 /100 | #156 | Good 64.5% |
| Canadians | 66.6 /100 | #157 | Good 64.4% |
| Lebanese | 66.4 /100 | #158 | Good 64.4% |
| Germans | 65.8 /100 | #159 | Good 64.4% |
| Immigrants | Moldova | 65.2 /100 | #160 | Good 64.4% |
| Immigrants | England | 62.6 /100 | #161 | Good 64.4% |
| British | 61.6 /100 | #162 | Good 64.4% |
Demographics Similar to Immigrants from Vietnam by Family Households
In terms of family households, the demographic groups most similar to Immigrants from Vietnam are Assyrian/Chaldean/Syriac (68.2%, a difference of 0.0%), Chinese (68.1%, a difference of 0.030%), Immigrants from Cuba (68.2%, a difference of 0.060%), Pueblo (68.2%, a difference of 0.070%), and Korean (68.3%, a difference of 0.15%).
| Demographics | Rating | Rank | Family Households |
| Native Hawaiians | 100.0 /100 | #9 | Exceptional 68.4% |
| Immigrants | Philippines | 100.0 /100 | #10 | Exceptional 68.3% |
| Immigrants | Central America | 100.0 /100 | #11 | Exceptional 68.3% |
| Koreans | 100.0 /100 | #12 | Exceptional 68.3% |
| Pueblo | 100.0 /100 | #13 | Exceptional 68.2% |
| Immigrants | Cuba | 100.0 /100 | #14 | Exceptional 68.2% |
| Assyrians/Chaldeans/Syriacs | 100.0 /100 | #15 | Exceptional 68.2% |
| Immigrants | Vietnam | 100.0 /100 | #16 | Exceptional 68.2% |
| Chinese | 100.0 /100 | #17 | Exceptional 68.1% |
| Immigrants | Taiwan | 100.0 /100 | #18 | Exceptional 68.0% |
| Samoans | 100.0 /100 | #19 | Exceptional 67.9% |
| Inupiat | 100.0 /100 | #20 | Exceptional 67.8% |
| Cubans | 100.0 /100 | #21 | Exceptional 67.7% |
| Sri Lankans | 100.0 /100 | #22 | Exceptional 67.7% |
| Immigrants | Pakistan | 100.0 /100 | #23 | Exceptional 67.7% |