Marshallese vs Spanish Family Households with Children
COMPARE
Marshallese
Spanish
Family Households with Children
Family Households with Children Comparison
Marshallese
Spanish
26.2%
FAMILY HOUSEHOLDS WITH CHILDREN
0.0/ 100
METRIC RATING
310th/ 347
METRIC RANK
27.7%
FAMILY HOUSEHOLDS WITH CHILDREN
81.8/ 100
METRIC RATING
140th/ 347
METRIC RANK
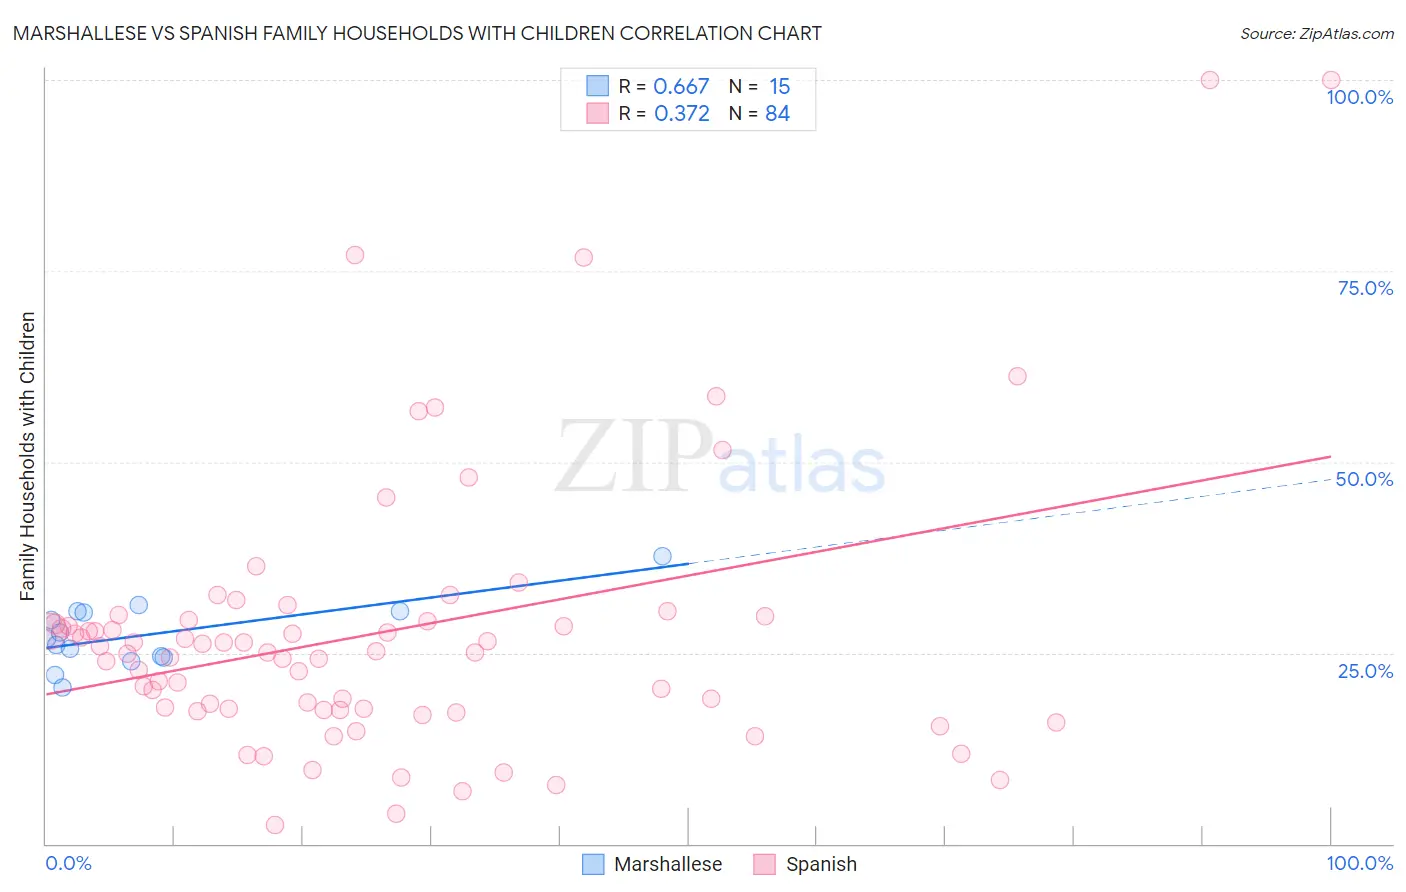
Marshallese vs Spanish Family Households with Children Correlation Chart
The statistical analysis conducted on geographies consisting of 14,760,991 people shows a significant positive correlation between the proportion of Marshallese and percentage of family households with children in the United States with a correlation coefficient (R) of 0.667 and weighted average of 26.2%. Similarly, the statistical analysis conducted on geographies consisting of 421,743,519 people shows a mild positive correlation between the proportion of Spanish and percentage of family households with children in the United States with a correlation coefficient (R) of 0.372 and weighted average of 27.7%, a difference of 5.4%.
Family Households with Children Correlation Summary
| Measurement | Marshallese | Spanish |
| Minimum | 20.5% | 2.5% |
| Maximum | 37.7% | 100.0% |
| Range | 17.2% | 97.5% |
| Mean | 27.4% | 27.7% |
| Median | 26.9% | 25.1% |
| Interquartile 25% (IQ1) | 24.3% | 17.6% |
| Interquartile 75% (IQ3) | 30.4% | 29.2% |
| Interquartile Range (IQR) | 6.1% | 11.6% |
| Standard Deviation (Sample) | 4.3% | 18.1% |
| Standard Deviation (Population) | 4.2% | 18.0% |
Similar Demographics by Family Households with Children
Demographics Similar to Marshallese by Family Households with Children
In terms of family households with children, the demographic groups most similar to Marshallese are Immigrants from Somalia (26.3%, a difference of 0.050%), Colville (26.2%, a difference of 0.050%), Immigrants from Czechoslovakia (26.2%, a difference of 0.12%), Lumbee (26.3%, a difference of 0.16%), and West Indian (26.3%, a difference of 0.18%).
| Demographics | Rating | Rank | Family Households with Children |
| Immigrants | Guyana | 0.1 /100 | #303 | Tragic 26.3% |
| Immigrants | Bahamas | 0.1 /100 | #304 | Tragic 26.3% |
| Guyanese | 0.1 /100 | #305 | Tragic 26.3% |
| Bermudans | 0.1 /100 | #306 | Tragic 26.3% |
| West Indians | 0.0 /100 | #307 | Tragic 26.3% |
| Lumbee | 0.0 /100 | #308 | Tragic 26.3% |
| Immigrants | Somalia | 0.0 /100 | #309 | Tragic 26.3% |
| Marshallese | 0.0 /100 | #310 | Tragic 26.2% |
| Colville | 0.0 /100 | #311 | Tragic 26.2% |
| Immigrants | Czechoslovakia | 0.0 /100 | #312 | Tragic 26.2% |
| Cree | 0.0 /100 | #313 | Tragic 26.2% |
| French Canadians | 0.0 /100 | #314 | Tragic 26.1% |
| Immigrants | Norway | 0.0 /100 | #315 | Tragic 26.1% |
| Estonians | 0.0 /100 | #316 | Tragic 26.1% |
| Ottawa | 0.0 /100 | #317 | Tragic 26.1% |
Demographics Similar to Spanish by Family Households with Children
In terms of family households with children, the demographic groups most similar to Spanish are Immigrants from Eastern Asia (27.7%, a difference of 0.0%), Swiss (27.7%, a difference of 0.020%), Vietnamese (27.7%, a difference of 0.030%), Uruguayan (27.7%, a difference of 0.050%), and Immigrants from Eastern Africa (27.7%, a difference of 0.060%).
| Demographics | Rating | Rank | Family Households with Children |
| Iranians | 85.2 /100 | #133 | Excellent 27.7% |
| Immigrants | Panama | 84.9 /100 | #134 | Excellent 27.7% |
| Immigrants | Ecuador | 84.6 /100 | #135 | Excellent 27.7% |
| Immigrants | Portugal | 84.1 /100 | #136 | Excellent 27.7% |
| Immigrants | Dominican Republic | 83.9 /100 | #137 | Excellent 27.7% |
| Uruguayans | 83.2 /100 | #138 | Excellent 27.7% |
| Vietnamese | 82.6 /100 | #139 | Excellent 27.7% |
| Spanish | 81.8 /100 | #140 | Excellent 27.7% |
| Immigrants | Eastern Asia | 81.7 /100 | #141 | Excellent 27.7% |
| Swiss | 81.4 /100 | #142 | Excellent 27.7% |
| Immigrants | Eastern Africa | 80.2 /100 | #143 | Excellent 27.7% |
| Brazilians | 79.6 /100 | #144 | Good 27.7% |
| Immigrants | Chile | 79.5 /100 | #145 | Good 27.7% |
| Basques | 79.5 /100 | #146 | Good 27.7% |
| Immigrants | Moldova | 79.1 /100 | #147 | Good 27.6% |