Liberian vs Indonesian Family Households with Children
COMPARE
Liberian
Indonesian
Family Households with Children
Family Households with Children Comparison
Liberians
Indonesians
28.3%
FAMILY HOUSEHOLDS WITH CHILDREN
99.6/ 100
METRIC RATING
88th/ 347
METRIC RANK
28.1%
FAMILY HOUSEHOLDS WITH CHILDREN
98.8/ 100
METRIC RATING
100th/ 347
METRIC RANK
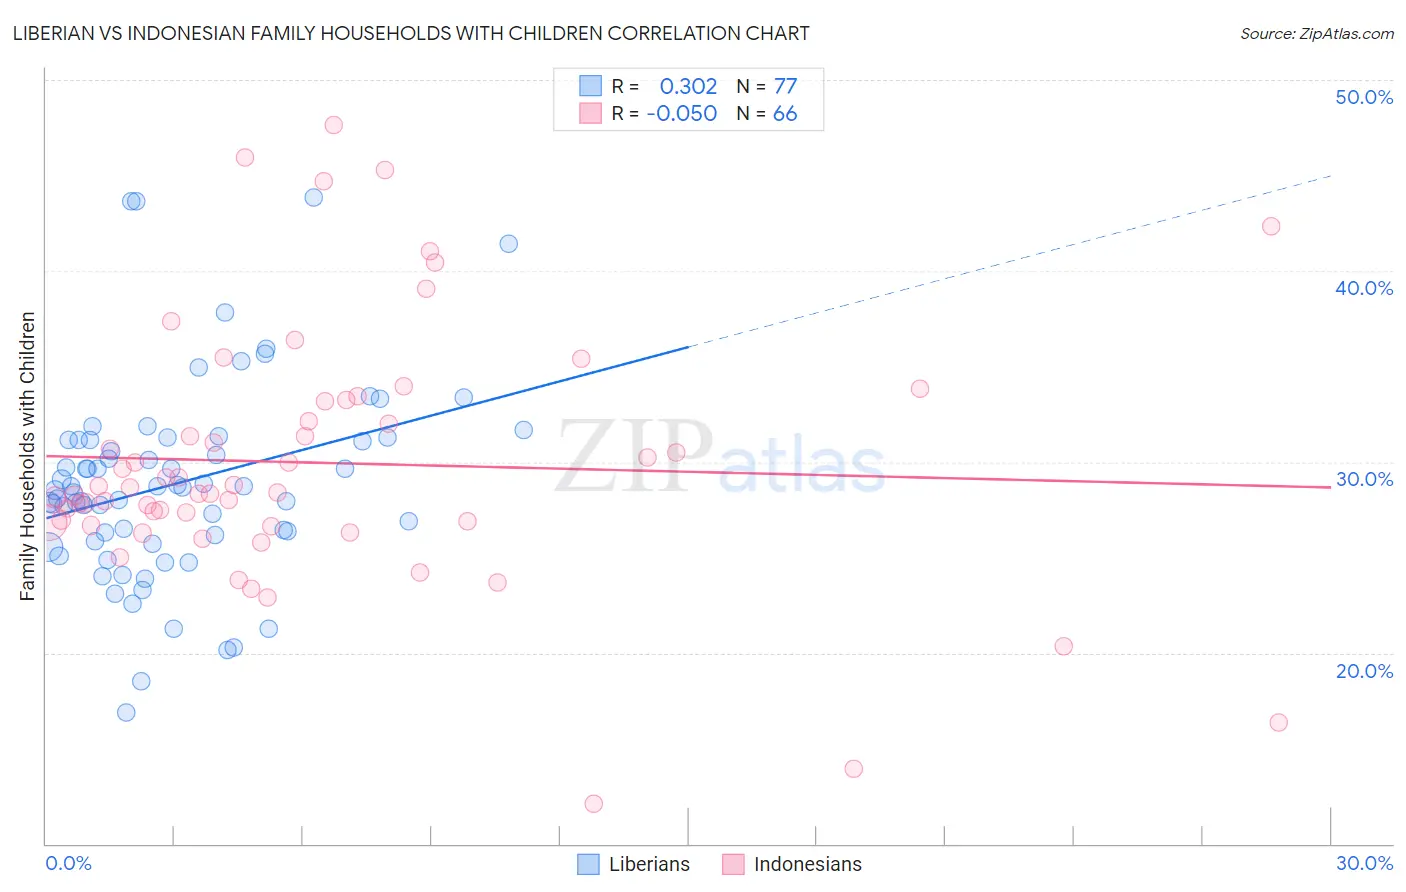
Liberian vs Indonesian Family Households with Children Correlation Chart
The statistical analysis conducted on geographies consisting of 118,011,319 people shows a mild positive correlation between the proportion of Liberians and percentage of family households with children in the United States with a correlation coefficient (R) of 0.302 and weighted average of 28.3%. Similarly, the statistical analysis conducted on geographies consisting of 162,603,576 people shows a slight negative correlation between the proportion of Indonesians and percentage of family households with children in the United States with a correlation coefficient (R) of -0.050 and weighted average of 28.1%, a difference of 0.55%.
Family Households with Children Correlation Summary
| Measurement | Liberian | Indonesian |
| Minimum | 16.9% | 12.1% |
| Maximum | 43.8% | 47.7% |
| Range | 27.0% | 35.6% |
| Mean | 28.9% | 29.9% |
| Median | 28.7% | 28.5% |
| Interquartile 25% (IQ1) | 26.0% | 26.8% |
| Interquartile 75% (IQ3) | 31.2% | 33.2% |
| Interquartile Range (IQR) | 5.1% | 6.4% |
| Standard Deviation (Sample) | 5.2% | 6.8% |
| Standard Deviation (Population) | 5.2% | 6.7% |
Demographics Similar to Liberians and Indonesians by Family Households with Children
In terms of family households with children, the demographic groups most similar to Liberians are Colombian (28.3%, a difference of 0.010%), Immigrants from Costa Rica (28.3%, a difference of 0.010%), Immigrants from Western Africa (28.3%, a difference of 0.070%), Immigrants from Thailand (28.2%, a difference of 0.11%), and Immigrants from Liberia (28.2%, a difference of 0.16%). Similarly, the demographic groups most similar to Indonesians are Immigrants from the Azores (28.1%, a difference of 0.0%), Immigrants from Kenya (28.1%, a difference of 0.010%), Immigrants from Oceania (28.1%, a difference of 0.020%), Assyrian/Chaldean/Syriac (28.1%, a difference of 0.050%), and Chilean (28.1%, a difference of 0.060%).
| Demographics | Rating | Rank | Family Households with Children |
| Costa Ricans | 99.8 /100 | #84 | Exceptional 28.4% |
| Immigrants | Syria | 99.8 /100 | #85 | Exceptional 28.4% |
| Immigrants | Western Africa | 99.6 /100 | #86 | Exceptional 28.3% |
| Colombians | 99.6 /100 | #87 | Exceptional 28.3% |
| Liberians | 99.6 /100 | #88 | Exceptional 28.3% |
| Immigrants | Costa Rica | 99.6 /100 | #89 | Exceptional 28.3% |
| Immigrants | Thailand | 99.5 /100 | #90 | Exceptional 28.2% |
| Immigrants | Liberia | 99.4 /100 | #91 | Exceptional 28.2% |
| Chickasaw | 99.4 /100 | #92 | Exceptional 28.2% |
| Panamanians | 99.3 /100 | #93 | Exceptional 28.2% |
| Immigrants | Colombia | 99.2 /100 | #94 | Exceptional 28.2% |
| Immigrants | Nicaragua | 99.1 /100 | #95 | Exceptional 28.2% |
| Ute | 99.1 /100 | #96 | Exceptional 28.2% |
| Chileans | 98.9 /100 | #97 | Exceptional 28.1% |
| Immigrants | Kenya | 98.9 /100 | #98 | Exceptional 28.1% |
| Immigrants | Azores | 98.8 /100 | #99 | Exceptional 28.1% |
| Indonesians | 98.8 /100 | #100 | Exceptional 28.1% |
| Immigrants | Oceania | 98.8 /100 | #101 | Exceptional 28.1% |
| Assyrians/Chaldeans/Syriacs | 98.7 /100 | #102 | Exceptional 28.1% |
| Palestinians | 98.5 /100 | #103 | Exceptional 28.1% |
| Sioux | 98.3 /100 | #104 | Exceptional 28.1% |