Maltese vs Apache Unemployment Among Ages 35 to 44 years
COMPARE
Maltese
Apache
Unemployment Among Ages 35 to 44 years
Unemployment Among Ages 35 to 44 years Comparison
Maltese
Apache
4.5%
UNEMPLOYMENT AMONG AGES 35 TO 44 YEARS
88.1/ 100
METRIC RATING
115th/ 347
METRIC RANK
8.4%
UNEMPLOYMENT AMONG AGES 35 TO 44 YEARS
0.0/ 100
METRIC RATING
336th/ 347
METRIC RANK
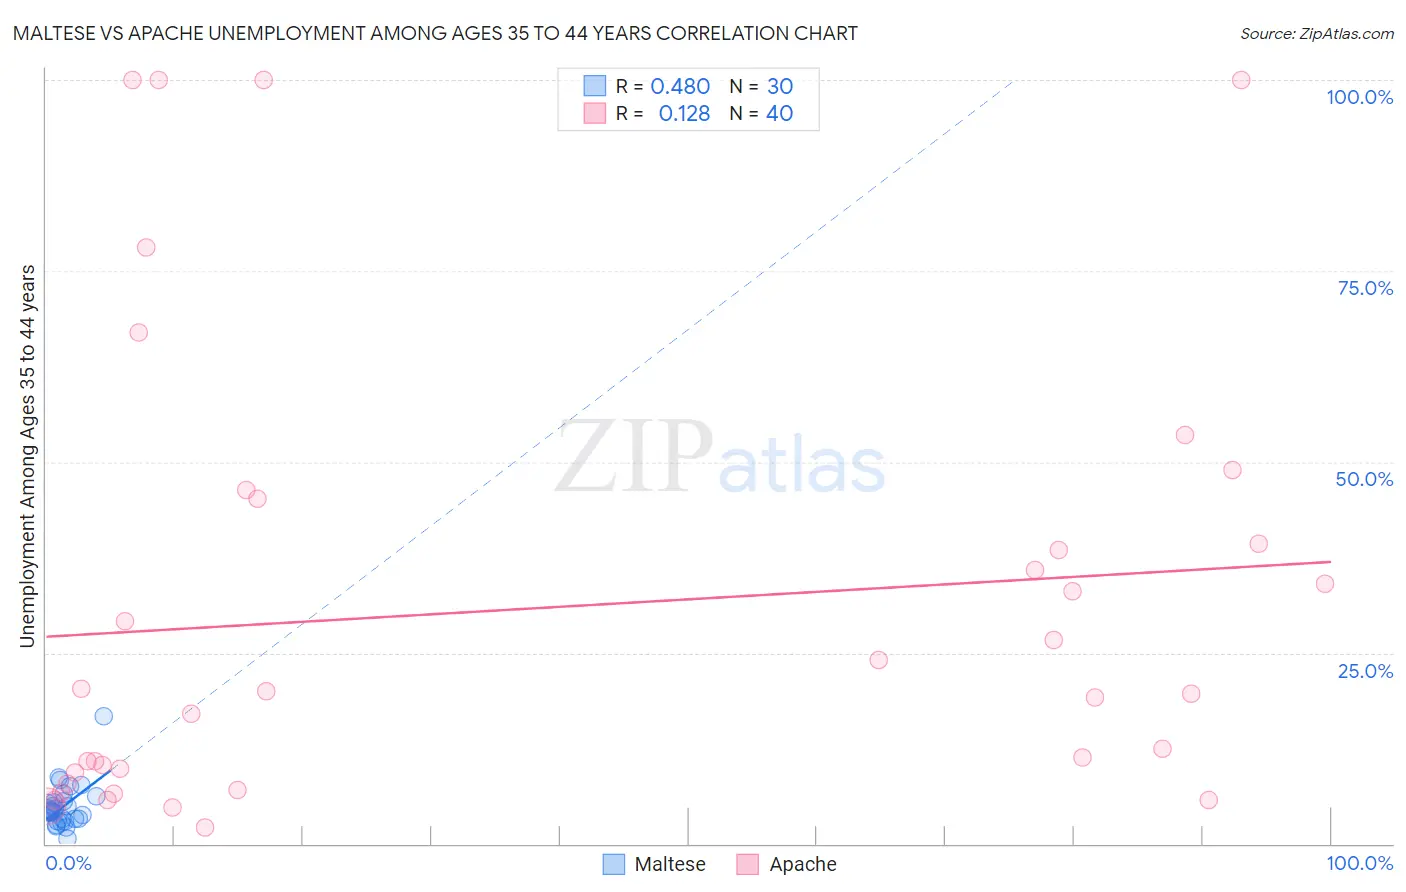
Maltese vs Apache Unemployment Among Ages 35 to 44 years Correlation Chart
The statistical analysis conducted on geographies consisting of 125,326,495 people shows a moderate positive correlation between the proportion of Maltese and unemployment rate among population between the ages 35 and 44 in the United States with a correlation coefficient (R) of 0.480 and weighted average of 4.5%. Similarly, the statistical analysis conducted on geographies consisting of 227,734,938 people shows a poor positive correlation between the proportion of Apache and unemployment rate among population between the ages 35 and 44 in the United States with a correlation coefficient (R) of 0.128 and weighted average of 8.4%, a difference of 85.9%.
Unemployment Among Ages 35 to 44 years Correlation Summary
| Measurement | Maltese | Apache |
| Minimum | 0.60% | 2.1% |
| Maximum | 16.7% | 100.0% |
| Range | 16.1% | 97.9% |
| Mean | 4.9% | 30.7% |
| Median | 4.3% | 19.8% |
| Interquartile 25% (IQ1) | 3.2% | 8.6% |
| Interquartile 75% (IQ3) | 5.5% | 42.2% |
| Interquartile Range (IQR) | 2.3% | 33.5% |
| Standard Deviation (Sample) | 2.9% | 29.5% |
| Standard Deviation (Population) | 2.9% | 29.2% |
Similar Demographics by Unemployment Among Ages 35 to 44 years
Demographics Similar to Maltese by Unemployment Among Ages 35 to 44 years
In terms of unemployment among ages 35 to 44 years, the demographic groups most similar to Maltese are Immigrants from Israel (4.5%, a difference of 0.010%), Macedonian (4.5%, a difference of 0.030%), Immigrants from Greece (4.5%, a difference of 0.030%), Irish (4.5%, a difference of 0.040%), and Immigrants from Italy (4.5%, a difference of 0.050%).
| Demographics | Rating | Rank | Unemployment Among Ages 35 to 44 years |
| New Zealanders | 90.3 /100 | #108 | Exceptional 4.5% |
| Romanians | 90.3 /100 | #109 | Exceptional 4.5% |
| Immigrants | Kazakhstan | 90.0 /100 | #110 | Excellent 4.5% |
| Immigrants | Nicaragua | 89.8 /100 | #111 | Excellent 4.5% |
| Immigrants | Czechoslovakia | 89.2 /100 | #112 | Excellent 4.5% |
| Immigrants | Italy | 88.4 /100 | #113 | Excellent 4.5% |
| Macedonians | 88.3 /100 | #114 | Excellent 4.5% |
| Maltese | 88.1 /100 | #115 | Excellent 4.5% |
| Immigrants | Israel | 88.1 /100 | #116 | Excellent 4.5% |
| Immigrants | Greece | 87.9 /100 | #117 | Excellent 4.5% |
| Irish | 87.9 /100 | #118 | Excellent 4.5% |
| Nicaraguans | 87.6 /100 | #119 | Excellent 4.5% |
| Ethiopians | 87.1 /100 | #120 | Excellent 4.5% |
| Immigrants | South Africa | 86.8 /100 | #121 | Excellent 4.5% |
| Sri Lankans | 86.8 /100 | #122 | Excellent 4.5% |
Demographics Similar to Apache by Unemployment Among Ages 35 to 44 years
In terms of unemployment among ages 35 to 44 years, the demographic groups most similar to Apache are Sioux (8.4%, a difference of 0.29%), Tohono O'odham (8.4%, a difference of 0.36%), Cheyenne (8.5%, a difference of 0.87%), Inupiat (8.6%, a difference of 2.0%), and Alaskan Athabascan (8.6%, a difference of 2.7%).
| Demographics | Rating | Rank | Unemployment Among Ages 35 to 44 years |
| Paiute | 0.0 /100 | #329 | Tragic 6.9% |
| Immigrants | Cabo Verde | 0.0 /100 | #330 | Tragic 6.9% |
| Pueblo | 0.0 /100 | #331 | Tragic 7.1% |
| Natives/Alaskans | 0.0 /100 | #332 | Tragic 7.3% |
| Puerto Ricans | 0.0 /100 | #333 | Tragic 7.6% |
| Houma | 0.0 /100 | #334 | Tragic 7.8% |
| Sioux | 0.0 /100 | #335 | Tragic 8.4% |
| Apache | 0.0 /100 | #336 | Tragic 8.4% |
| Tohono O'odham | 0.0 /100 | #337 | Tragic 8.4% |
| Cheyenne | 0.0 /100 | #338 | Tragic 8.5% |
| Inupiat | 0.0 /100 | #339 | Tragic 8.6% |
| Alaskan Athabascans | 0.0 /100 | #340 | Tragic 8.6% |
| Hopi | 0.0 /100 | #341 | Tragic 8.9% |
| Navajo | 0.0 /100 | #342 | Tragic 9.3% |
| Arapaho | 0.0 /100 | #343 | Tragic 10.3% |