Lumbee vs Polish Family Households with Children
COMPARE
Lumbee
Polish
Family Households with Children
Family Households with Children Comparison
Lumbee
Poles
26.3%
FAMILY HOUSEHOLDS WITH CHILDREN
0.0/ 100
METRIC RATING
308th/ 347
METRIC RANK
26.5%
FAMILY HOUSEHOLDS WITH CHILDREN
0.2/ 100
METRIC RATING
292nd/ 347
METRIC RANK
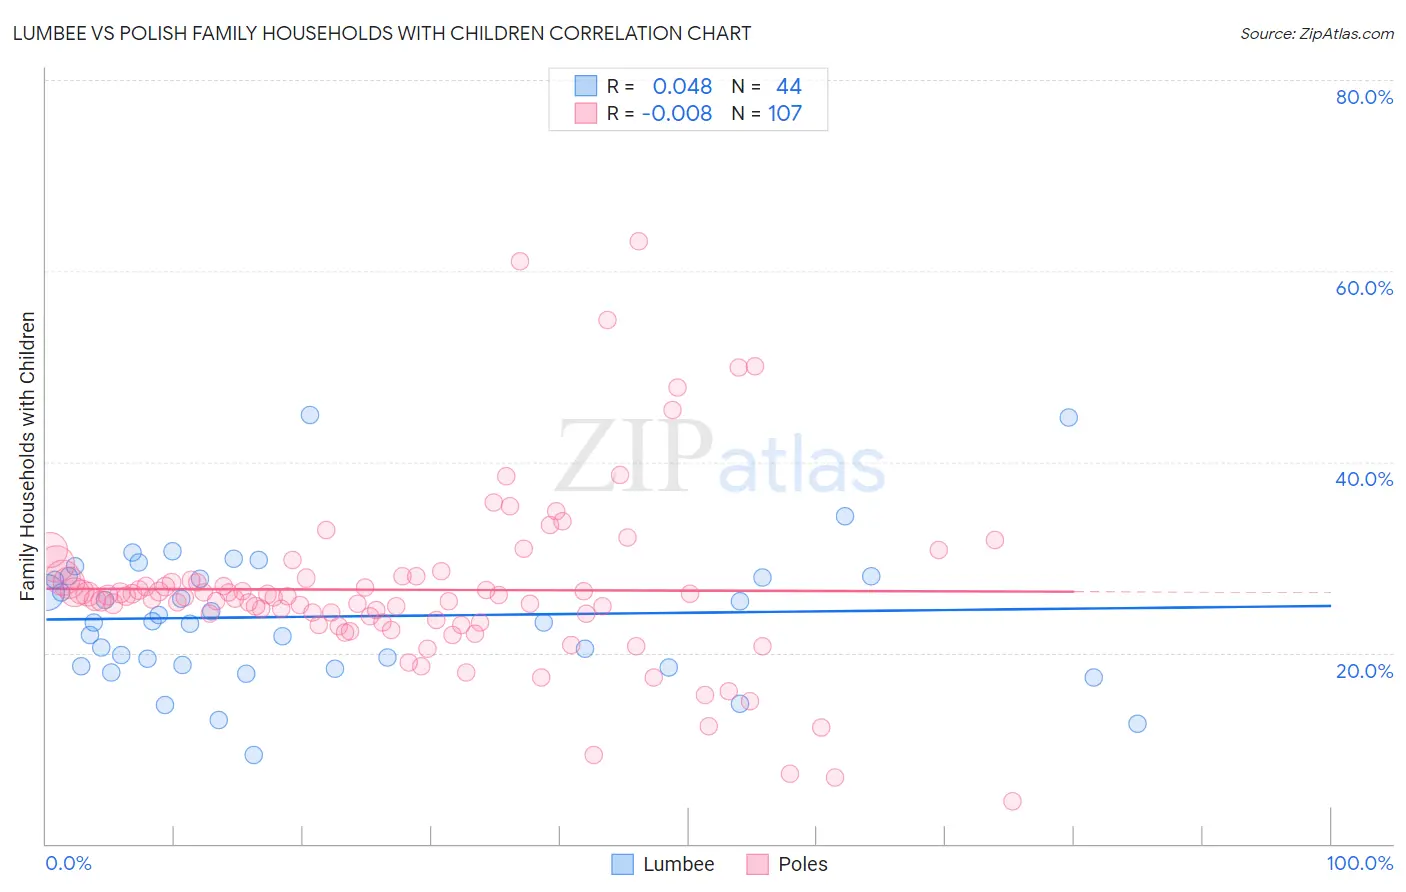
Lumbee vs Polish Family Households with Children Correlation Chart
The statistical analysis conducted on geographies consisting of 92,262,389 people shows no correlation between the proportion of Lumbee and percentage of family households with children in the United States with a correlation coefficient (R) of 0.048 and weighted average of 26.3%. Similarly, the statistical analysis conducted on geographies consisting of 559,563,318 people shows no correlation between the proportion of Poles and percentage of family households with children in the United States with a correlation coefficient (R) of -0.008 and weighted average of 26.5%, a difference of 0.70%.
Family Households with Children Correlation Summary
| Measurement | Lumbee | Polish |
| Minimum | 9.3% | 4.5% |
| Maximum | 44.9% | 63.2% |
| Range | 35.5% | 58.7% |
| Mean | 23.8% | 26.6% |
| Median | 23.2% | 25.8% |
| Interquartile 25% (IQ1) | 18.7% | 23.1% |
| Interquartile 75% (IQ3) | 27.9% | 27.8% |
| Interquartile Range (IQR) | 9.2% | 4.7% |
| Standard Deviation (Sample) | 7.2% | 9.3% |
| Standard Deviation (Population) | 7.1% | 9.2% |
Demographics Similar to Lumbee and Poles by Family Households with Children
In terms of family households with children, the demographic groups most similar to Lumbee are West Indian (26.3%, a difference of 0.020%), Bermudan (26.3%, a difference of 0.10%), Immigrants from Somalia (26.3%, a difference of 0.11%), Guyanese (26.3%, a difference of 0.12%), and Immigrants from Bahamas (26.3%, a difference of 0.14%). Similarly, the demographic groups most similar to Poles are Albanian (26.5%, a difference of 0.010%), Bahamian (26.5%, a difference of 0.010%), Black/African American (26.5%, a difference of 0.050%), Latvian (26.4%, a difference of 0.11%), and Macedonian (26.4%, a difference of 0.18%).
| Demographics | Rating | Rank | Family Households with Children |
| Albanians | 0.2 /100 | #290 | Tragic 26.5% |
| Bahamians | 0.2 /100 | #291 | Tragic 26.5% |
| Poles | 0.2 /100 | #292 | Tragic 26.5% |
| Blacks/African Americans | 0.1 /100 | #293 | Tragic 26.5% |
| Latvians | 0.1 /100 | #294 | Tragic 26.4% |
| Macedonians | 0.1 /100 | #295 | Tragic 26.4% |
| Croatians | 0.1 /100 | #296 | Tragic 26.4% |
| Armenians | 0.1 /100 | #297 | Tragic 26.4% |
| Immigrants | Western Europe | 0.1 /100 | #298 | Tragic 26.4% |
| Trinidadians and Tobagonians | 0.1 /100 | #299 | Tragic 26.4% |
| Paiute | 0.1 /100 | #300 | Tragic 26.4% |
| Immigrants | Trinidad and Tobago | 0.1 /100 | #301 | Tragic 26.4% |
| Serbians | 0.1 /100 | #302 | Tragic 26.4% |
| Immigrants | Guyana | 0.1 /100 | #303 | Tragic 26.3% |
| Immigrants | Bahamas | 0.1 /100 | #304 | Tragic 26.3% |
| Guyanese | 0.1 /100 | #305 | Tragic 26.3% |
| Bermudans | 0.1 /100 | #306 | Tragic 26.3% |
| West Indians | 0.0 /100 | #307 | Tragic 26.3% |
| Lumbee | 0.0 /100 | #308 | Tragic 26.3% |
| Immigrants | Somalia | 0.0 /100 | #309 | Tragic 26.3% |
| Marshallese | 0.0 /100 | #310 | Tragic 26.2% |