Lumbee vs Immigrants from Peru Births to Unmarried Women
COMPARE
Lumbee
Immigrants from Peru
Births to Unmarried Women
Births to Unmarried Women Comparison
Lumbee
Immigrants from Peru
48.2%
BIRTHS TO UNMARRIED WOMEN
0.0/ 100
METRIC RATING
339th/ 347
METRIC RANK
31.8%
BIRTHS TO UNMARRIED WOMEN
45.1/ 100
METRIC RATING
181st/ 347
METRIC RANK
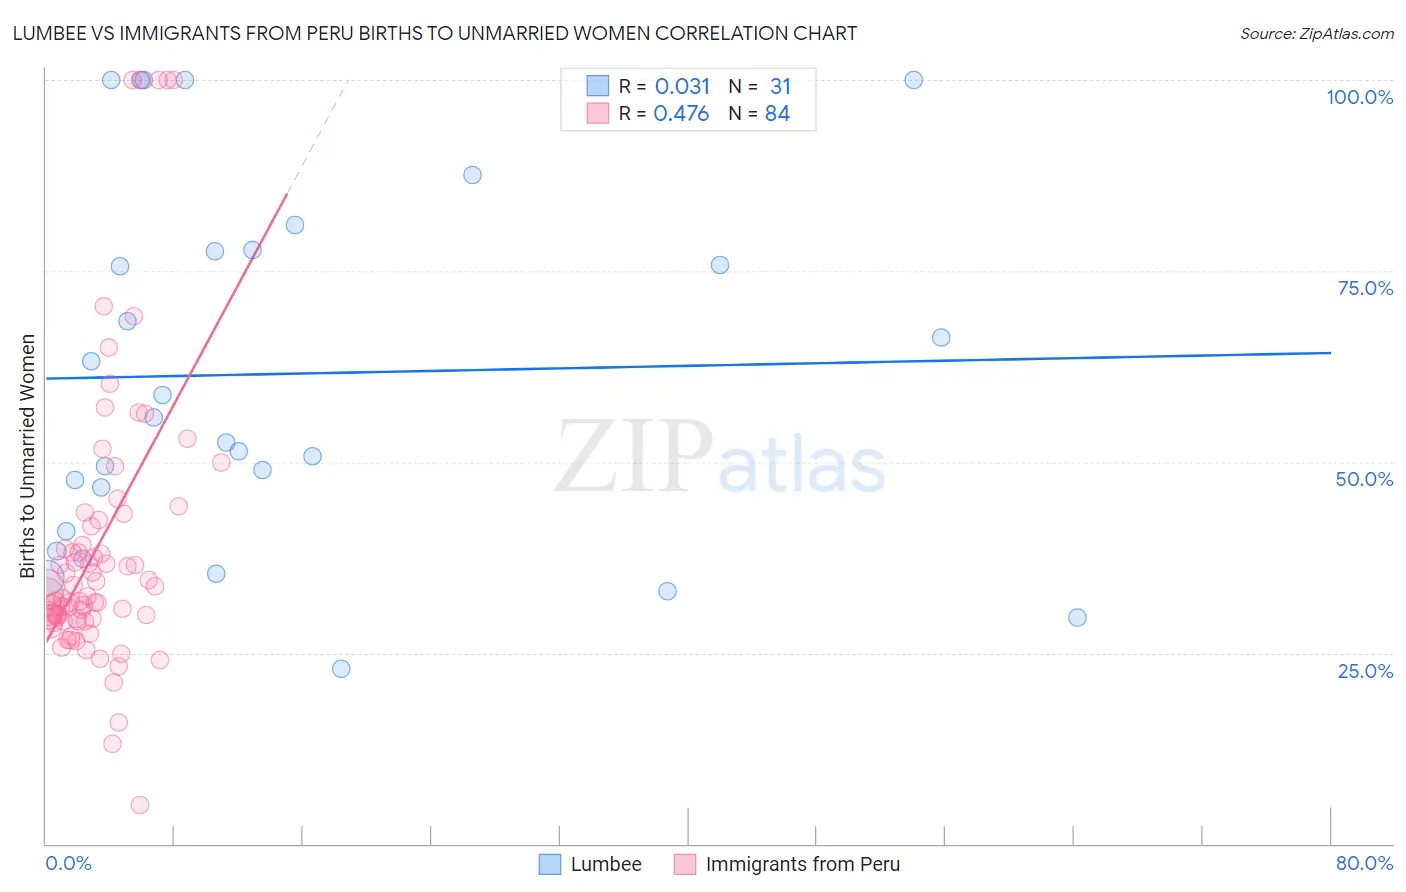
Lumbee vs Immigrants from Peru Births to Unmarried Women Correlation Chart
The statistical analysis conducted on geographies consisting of 89,846,476 people shows no correlation between the proportion of Lumbee and percentage of births to unmarried women in the United States with a correlation coefficient (R) of 0.031 and weighted average of 48.2%. Similarly, the statistical analysis conducted on geographies consisting of 311,348,081 people shows a moderate positive correlation between the proportion of Immigrants from Peru and percentage of births to unmarried women in the United States with a correlation coefficient (R) of 0.476 and weighted average of 31.8%, a difference of 51.5%.
Births to Unmarried Women Correlation Summary
| Measurement | Lumbee | Immigrants from Peru |
| Minimum | 22.9% | 5.1% |
| Maximum | 100.0% | 100.0% |
| Range | 77.1% | 94.9% |
| Mean | 61.5% | 39.0% |
| Median | 55.9% | 32.5% |
| Interquartile 25% (IQ1) | 40.9% | 29.5% |
| Interquartile 75% (IQ3) | 77.7% | 41.9% |
| Interquartile Range (IQR) | 36.8% | 12.4% |
| Standard Deviation (Sample) | 23.6% | 19.1% |
| Standard Deviation (Population) | 23.3% | 18.9% |
Similar Demographics by Births to Unmarried Women
Demographics Similar to Lumbee by Births to Unmarried Women
In terms of births to unmarried women, the demographic groups most similar to Lumbee are Arapaho (47.1%, a difference of 2.3%), Tohono O'odham (49.8%, a difference of 3.4%), Houma (46.6%, a difference of 3.5%), Hopi (50.8%, a difference of 5.4%), and Puerto Rican (45.7%, a difference of 5.5%).
| Demographics | Rating | Rank | Births to Unmarried Women |
| Kiowa | 0.0 /100 | #332 | Tragic 43.1% |
| Blacks/African Americans | 0.0 /100 | #333 | Tragic 44.3% |
| Yuman | 0.0 /100 | #334 | Tragic 44.4% |
| Colville | 0.0 /100 | #335 | Tragic 45.3% |
| Puerto Ricans | 0.0 /100 | #336 | Tragic 45.7% |
| Houma | 0.0 /100 | #337 | Tragic 46.6% |
| Arapaho | 0.0 /100 | #338 | Tragic 47.1% |
| Lumbee | 0.0 /100 | #339 | Tragic 48.2% |
| Tohono O'odham | 0.0 /100 | #340 | Tragic 49.8% |
| Hopi | 0.0 /100 | #341 | Tragic 50.8% |
| Menominee | 0.0 /100 | #342 | Tragic 51.1% |
| Pima | 0.0 /100 | #343 | Tragic 51.5% |
| Navajo | 0.0 /100 | #344 | Tragic 51.5% |
| Inupiat | 0.0 /100 | #345 | Tragic 52.1% |
| Pueblo | 0.0 /100 | #346 | Tragic 53.7% |
Demographics Similar to Immigrants from Peru by Births to Unmarried Women
In terms of births to unmarried women, the demographic groups most similar to Immigrants from Peru are Moroccan (31.8%, a difference of 0.060%), South American (31.8%, a difference of 0.18%), Kenyan (31.9%, a difference of 0.20%), English (31.7%, a difference of 0.22%), and South American Indian (31.7%, a difference of 0.25%).
| Demographics | Rating | Rank | Births to Unmarried Women |
| Venezuelans | 50.0 /100 | #174 | Average 31.7% |
| Immigrants | Venezuela | 49.2 /100 | #175 | Average 31.7% |
| Scottish | 48.1 /100 | #176 | Average 31.7% |
| South American Indians | 47.7 /100 | #177 | Average 31.7% |
| English | 47.4 /100 | #178 | Average 31.7% |
| South Americans | 46.9 /100 | #179 | Average 31.8% |
| Moroccans | 45.7 /100 | #180 | Average 31.8% |
| Immigrants | Peru | 45.1 /100 | #181 | Average 31.8% |
| Kenyans | 43.0 /100 | #182 | Average 31.9% |
| Canadians | 41.4 /100 | #183 | Average 31.9% |
| Immigrants | South America | 40.7 /100 | #184 | Average 32.0% |
| Germans | 39.5 /100 | #185 | Fair 32.0% |
| Welsh | 38.2 /100 | #186 | Fair 32.0% |
| Czechoslovakians | 38.0 /100 | #187 | Fair 32.0% |
| Osage | 37.1 /100 | #188 | Fair 32.1% |