Lumbee vs Immigrants from Peru Unemployment Among Ages 55 to 59 years
COMPARE
Lumbee
Immigrants from Peru
Unemployment Among Ages 55 to 59 years
Unemployment Among Ages 55 to 59 years Comparison
Lumbee
Immigrants from Peru
4.9%
UNEMPLOYMENT AMONG AGES 55 TO 59 YEARS
22.5/ 100
METRIC RATING
202nd/ 347
METRIC RANK
4.8%
UNEMPLOYMENT AMONG AGES 55 TO 59 YEARS
38.6/ 100
METRIC RATING
183rd/ 347
METRIC RANK
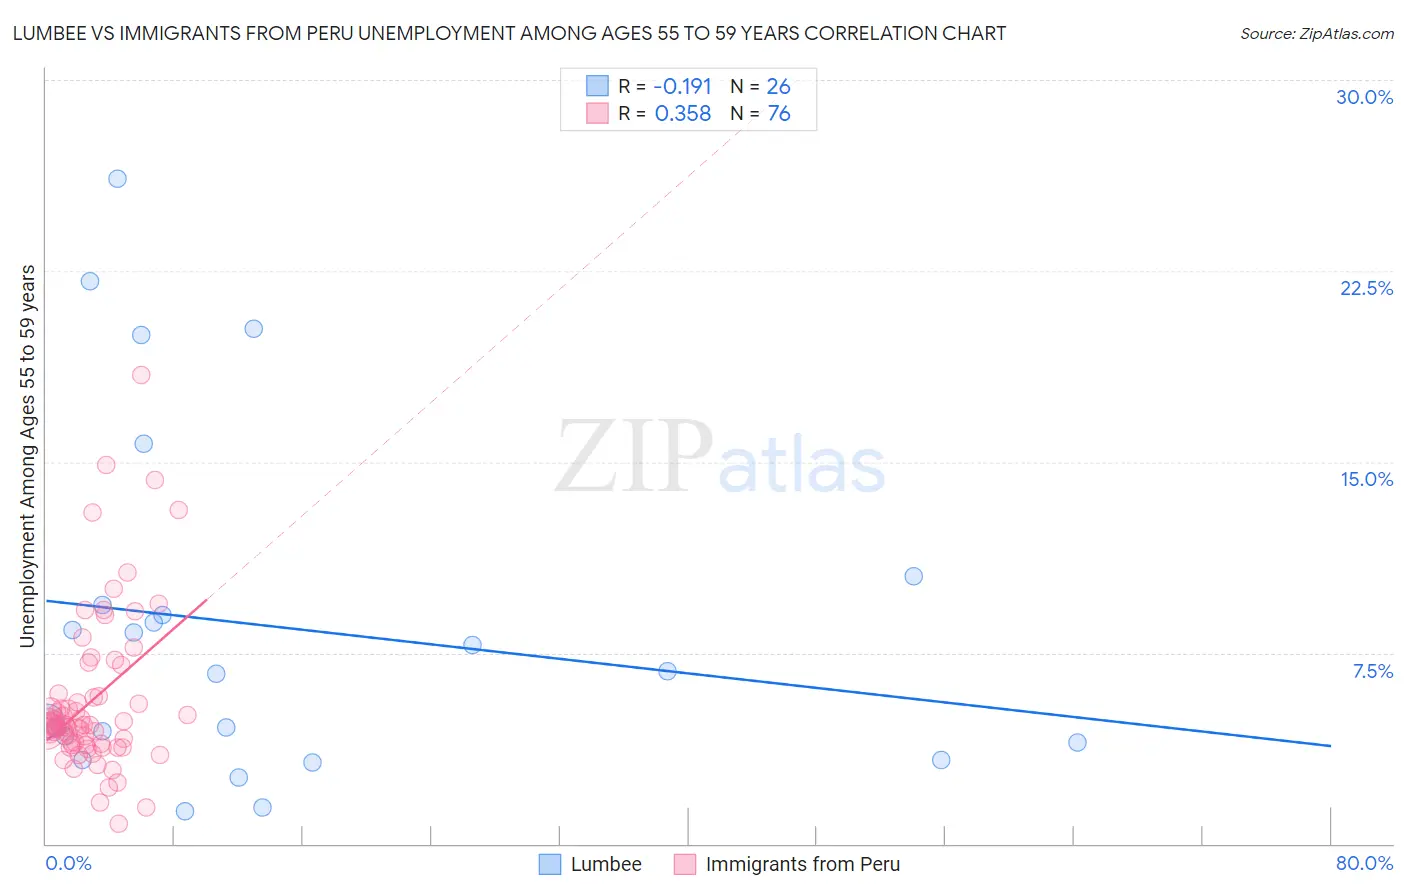
Lumbee vs Immigrants from Peru Unemployment Among Ages 55 to 59 years Correlation Chart
The statistical analysis conducted on geographies consisting of 88,900,260 people shows a poor negative correlation between the proportion of Lumbee and unemployment rate among population between the ages 55 and 59 in the United States with a correlation coefficient (R) of -0.191 and weighted average of 4.9%. Similarly, the statistical analysis conducted on geographies consisting of 313,256,453 people shows a mild positive correlation between the proportion of Immigrants from Peru and unemployment rate among population between the ages 55 and 59 in the United States with a correlation coefficient (R) of 0.358 and weighted average of 4.8%, a difference of 0.78%.
Unemployment Among Ages 55 to 59 years Correlation Summary
| Measurement | Lumbee | Immigrants from Peru |
| Minimum | 1.3% | 0.80% |
| Maximum | 26.1% | 18.4% |
| Range | 24.8% | 17.6% |
| Mean | 8.5% | 5.6% |
| Median | 6.8% | 4.7% |
| Interquartile 25% (IQ1) | 4.0% | 3.9% |
| Interquartile 75% (IQ3) | 9.4% | 5.9% |
| Interquartile Range (IQR) | 5.4% | 1.9% |
| Standard Deviation (Sample) | 6.8% | 3.1% |
| Standard Deviation (Population) | 6.6% | 3.1% |
Demographics Similar to Lumbee and Immigrants from Peru by Unemployment Among Ages 55 to 59 years
In terms of unemployment among ages 55 to 59 years, the demographic groups most similar to Lumbee are Immigrants from South America (4.9%, a difference of 0.030%), Basque (4.9%, a difference of 0.050%), Immigrants from Russia (4.9%, a difference of 0.070%), Immigrants from Philippines (4.9%, a difference of 0.20%), and Macedonian (4.9%, a difference of 0.21%). Similarly, the demographic groups most similar to Immigrants from Peru are Immigrants from Czechoslovakia (4.8%, a difference of 0.020%), Immigrants from Europe (4.8%, a difference of 0.070%), Peruvian (4.8%, a difference of 0.070%), Osage (4.8%, a difference of 0.070%), and Immigrants from Morocco (4.8%, a difference of 0.090%).
| Demographics | Rating | Rank | Unemployment Among Ages 55 to 59 years |
| Immigrants | Europe | 40.4 /100 | #182 | Average 4.8% |
| Immigrants | Peru | 38.6 /100 | #183 | Fair 4.8% |
| Immigrants | Czechoslovakia | 38.0 /100 | #184 | Fair 4.8% |
| Peruvians | 37.0 /100 | #185 | Fair 4.8% |
| Osage | 37.0 /100 | #186 | Fair 4.8% |
| Immigrants | Morocco | 36.5 /100 | #187 | Fair 4.8% |
| Immigrants | Eastern Asia | 36.1 /100 | #188 | Fair 4.8% |
| Iroquois | 34.5 /100 | #189 | Fair 4.9% |
| Russians | 33.9 /100 | #190 | Fair 4.9% |
| Iranians | 32.4 /100 | #191 | Fair 4.9% |
| Immigrants | Ukraine | 31.7 /100 | #192 | Fair 4.9% |
| Immigrants | Italy | 30.1 /100 | #193 | Fair 4.9% |
| Spaniards | 27.2 /100 | #194 | Fair 4.9% |
| Estonians | 27.2 /100 | #195 | Fair 4.9% |
| Eastern Europeans | 26.7 /100 | #196 | Fair 4.9% |
| Macedonians | 26.4 /100 | #197 | Fair 4.9% |
| Immigrants | Philippines | 26.1 /100 | #198 | Fair 4.9% |
| Immigrants | Russia | 23.7 /100 | #199 | Fair 4.9% |
| Basques | 23.3 /100 | #200 | Fair 4.9% |
| Immigrants | South America | 23.1 /100 | #201 | Fair 4.9% |
| Lumbee | 22.5 /100 | #202 | Fair 4.9% |